- Follow us:
- Our Commodities:
-
October 2012
Compared to previous seasons, the average quality of the 2011/2012 wheat crop fared well. The whole wheat protein average was 11,8% (12% mb) compared to the 12,1% of the 2010/2011 season and the ten year average of 12%.
The average hectolitre mass was 80,7 kg/hl and slightly higher than the 80,3 kg/hl of the 2010/2011 season. The average peak time of 3 minutes was similar to the previous two seasons. 41% of the 433 samples analysed as part of this survey, graded as grade B1.
This season’s average falling number was 387 seconds, only eleven of the samples analysed gave falling number values below 250 seconds; all of these samples were from the Free State production regions. The overall flour and dough quality were good, slightly weaker than the 2010/2011 season, but compared well with the previous three seasons.
Composite samples per class and grade were prepared, milled and analysed for baking quality. Differences in average quality were smaller between the four production areas (winter rainfall, summer rainfall [Free State], irrigation and other summer rainfall and irrigation areas [Mpumalanga, Gauteng and Limpopo]) than in previous seasons.
Bühler milling extraction varied between 73,3% (winter as well as summer rainfall areas) to 75% in the irrigation areas and 75,2% in the other summer rainfall and irrigation areas. The average flour protein content in the winter rainfall area was 10,4%, all three other areas averaged a flour protein content of 10,7%.
The wet gluten content ranged between 28,1% (14% mb) in the winter rainfall area to 29,4% in the irrigation areas. The irrigation areas also reported the highest farinogram water absorption (14% mb) of 61,7% and the other summer rainfall and irrigation areas the lowest, namely 60,9%. The alveogram strength values ranged from 33,0 cm2 in the winter rainfall area to 37,3 cm2 in the summer rainfall area. Mixogram peak times varied from 2,7 minutes in the irrigation areas to 3,2 minutes in the summer rainfall area.
40 samples (representing different regions as well as different grades) were selected randomly for mycotoxin analyses by means of a multi-mycotoxin screening method using UPLC-MS/MS. Only deoxynivalenol were detected on two samples at levels well below the international maximum acceptable levels for cereals.
Arguably, the most important quality parameter in any industry is consistency. A miller or baker can optimise their processes to obtain an acceptable product from raw material over a wide quality range. The key factor here is that they should consistently receive the poor, intermediate or good quality raw material. Problems arise when the raw material quality varies, which inevitably means that processes has to be adjusted or adapted (e.g. milling conditions or bakery recipes/ mixing times).
In Table 1 a summary is given of the average South African quality data gathered over nine seasons. These quality parameters are generally used to provide an indication of the baking quality of wheat. As no specification value exists for the evaluation of data over years, the repeatability or reproducibility specification value prescribed by the suppliers of the different instruments were used for the evaluation.
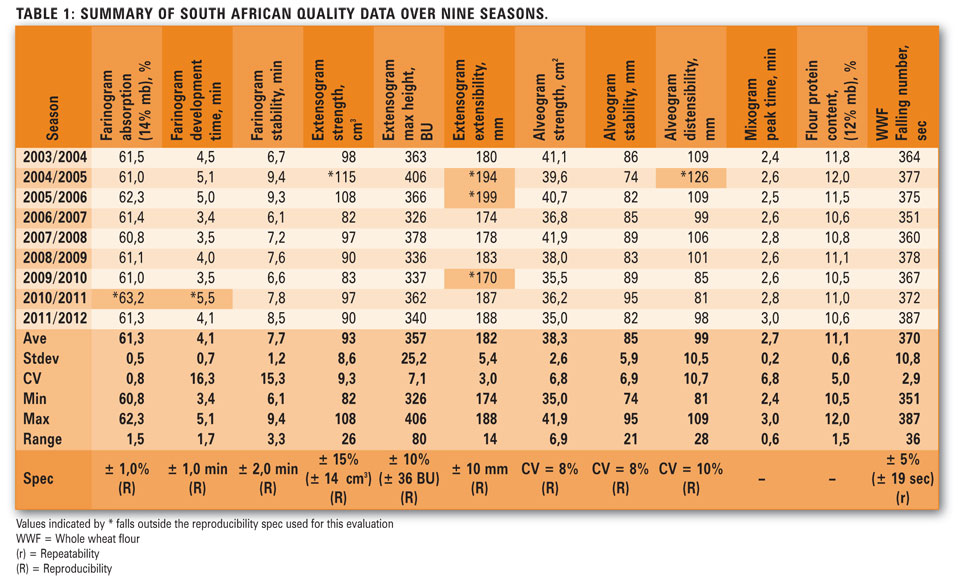
Repeatability can be defined as the variation in measurements obtained on the same sample by using the same measurement procedure, on the same measuring instrument, under the same measuring conditions in the same location/laboratory by the same analyst and with repetition over a short period of time. Reproducibility can be defined as the variation in measurement obtained on the same sample if all the other conditions changed.
Since the comparison in Table 1 is based on different samples from nine different seasons, the conclusion can be drawn that the local wheat’s consistency in baking quality over seasons is very good.
Imported wheat– quantity and quality
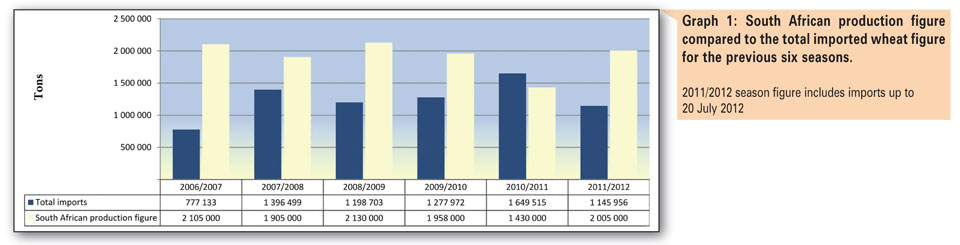
Graph 1’s figures are based on progressive import figures obtained from the SAGIS web page as well as final calculated crop production figures from the Crop Estimates Committee.
The range of quality analyses performed on the local wheat for the purpose of the annual crop quality survey, is also performed on the imported wheat samples received from the various ports in South Africa.
See Table 2 for a summary of the average quality data of imported wheat per country during the 2010/2011 season (previous season). This data is compared to the average South African crop quality data of the same season.
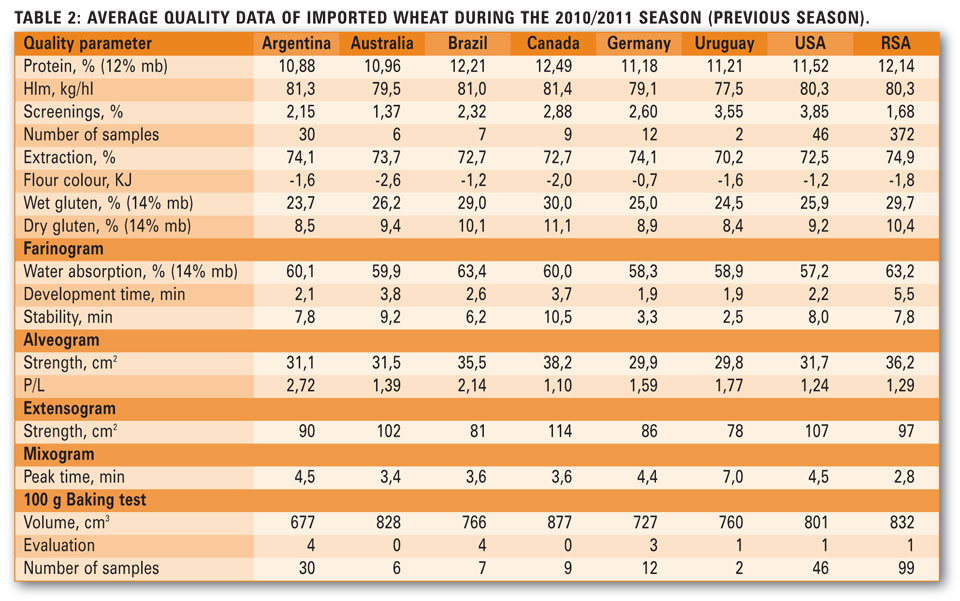
In general, bakers prefer flour with higher water absorption (60,0% - 65,0%) as this results in higher dough yields. The farinogram development times of the imported wheat (Australia and Canada excluded) were much shorter than the South African wheat. A short stability, as observed on the wheat from Germany and Uruguay, is an indication that the dough will not have a good tolerance to mixing and may be over or under mixed very easily. In general, longer development times of 3,5 to 6,0 minutes and stabilities of 8,0 to 12,0 minutes, will be an indication of good baking quality, which is associated with better protein quality.
Protein quality determines the alveogram strength and the Canadian and South African wheat had the highest strength values. The imported wheat samples tended to have short distensibility values on the alveogram, which may result in lower volumes. The short distensibility values also resulted in high P/L values (stability value divided by distensibility value). The ideal P/L value is between 0,80 and 1,20.
A tendency towards longer mixogram mixing times is showed by the imported wheat samples, especially Uruguay, but also Argentina, Germany and the USA. The mixing time is an indication of the amount of time needed to mix the dough to optimum development. The most acceptable range is between 2,8 to 3,5 minutes. The longer the mixing time, the larger the risk that the dough will not be mixed to optimum development, which may negatively influence the bread quality and cause lower loaf volumes. Longer mixing times can also have cost implications due to higher energy inputs required.
With gratitude to the Winter Cereal Trust for its financial support in conducting these surveys, the Grain Silo Industry and Millers for providing representative samples of the local crop as well as DAFF inspectors at the harbours for providing representative samples of each shipment of imported wheat.
Publication: October 2012
Section: Input Overview
