- Follow us:
- Our Commodities:
-


The Wheat Breeding Platform was launched on 31 October at the Welgevallen Experimental Farm of Stellenbosch University. Established in 2014 as a consortium consisting of both public and private partners, the platform seeks to assist South African wheat producers to increase their production through the development of germplasm with targeted yield improvement through drought/heat tolerance or other factors.
The platform is an initiative by government and the private sector to perform adequate research and development towards developing new cultivars able to adapt to the changing environment. Partners include Grain SA, DST, DAFF, the ARC, Sensako, Pannar and Stellenbosch University, among others, and is part of the implementation of the South African Bio-economy Strategy. The platform has received co-funding of approximately R20 million per annum from the Winter Cereal Trust in the last three years.
View the photo gallery below
 |
According to the CEC’s intentions to plant report released at the end of October, the expected maize hectares which will be planted for the 2018/19 season is 2.47 million, only 6% less than the current season’s hectares planted. The expected white maize hectares of 1.404 million are 14.5% less than the current season, while the expected yellow maize hectares of 1.066 million are 8.2% higher than the current seasons planted hectares. The expected soybean hectares are estimated at 720 000, around 25.4% more than the current season’s area planted, while the sunflower hectares are expected to increase by around 4.7% to 665 500. The groundnut and sorghum hectares planted for the season is expected to increase by around 17% and 3.2% respectively.
Supply and demand scenario’s
Tables 1, 2 and 3 indicate short summaries of possible supply and demand scenario’s which may realise in the coming season, given the current intentions to plant and possible yield assumptions. The supply and demand scenarios for maize, soybeans and sunflower seed were compiled with the following assumptions.
Table 1 indicate the possible maize supply and demand scenarios for the 2017/18 season should the current intentions to plant realise. It is clear from Table 1 that should the first scenario (low yields) occur in the coming season, a possible exportable surplus of around 1.45 million ton might exist for the 2018/19 season. Resulting in the season’s production coupled with carry-over stocks from the current season, will be sufficient to meet local demand, but would not lead to large exportable surpluses. This might cause the market for a while to trade at export parity level, but likely with some quick show of recovery. If Scenario 2 occurs in the coming season, the exportable surplus for the 2018/19 season may reach levels of around 3.85 million tons. With these large surpluses the market is likely to remain at export parity levels for a longer period, and failing exports taking place at the preferred pace, large carryover stocks may yet again realise at the end of the marketing season. If records yields are achieved in the next season, production may reach levels of above 15 million tons, leaving the country with an exportable a surplus of almost 8 million tons for the season.
Table 1: Supply and demand scenarios of maize for the 2018/19 season given the current intentions to plant
|
2018/19 |
2018/19 |
2018/19 |
|
|
Scenario 1 |
Scenario 2 |
Scenario 3 |
|
|
*Oppervlakte / Area (x 1000ha) |
2 470 |
2 470 |
2 470 |
|
**Opbrengs / Yield (ton/ha) |
3.73 |
4.72 |
6.42 |
|
***Produksie / Production (x 1000 ton) |
9 208 |
11 655 |
15 863 |
|
(‘000 ton) |
(‘000 ton) |
(‘000 ton) |
|
|
Begin voorraad / Opening stocks |
4 350 |
4 350 |
4 350 |
|
Totale aanbod / Total supply |
13 031 |
15 435 |
19 542 |
|
Total vraag / Total demand |
10 293 |
10 293 |
10 293 |
|
Eindvoorraad / Ending stocks |
2 738 |
5 142 |
9 249 |
|
Pyplyn benodighede / Pipeline requirements (1.5 months) |
1287 |
1287 |
1287 |
|
Uitvoerbare surplus / Exportable surplus |
1 451 |
3 855 |
7 962 |
*area planted based on the current CEC’s intentions to plant
**yield is assumptions as discussed above
***Production is calculated by multiplying the area planted by the yields
Table 2 indicate possible soybean supply and demand scenarios for the 2018/19 season. It clearly indicate that soybean ending stocks for the current season are likely to be higher than the ending stocks initially anticipated. The main focus currently in the soybean market is crushing of soybeans to produce oil and oil cake. Crushing for the season to date is lower than expected given this season’s large crop and the positive crushing margins. Several factors contributed to the lower than expected pace of the crushing, amongst which was the technical difficulties experienced at some plants during the season. A lot of questions were raised as to the actual domestic demand for soybeans, of which the main factor to consider, is the demand for soybean oil cake. Domestic soybean consumption is more than what is produced locally, with local soybean crushing capacity to meet local oil cake demand without importing, at around 1.5-1.6 million ton soybeans per year. In the below scenarios, soybean crushing was used as a balancing figure to represent the amount of soybeans needed to be crushed locally in order to prevent large carryover stocks at the end of the 2018/19 season. It is clear that if the yields are below average to average, the crushing for the season needs to be slightly above average given the current intentions to plant. If a record yield is achieved in the coming season, the soybean crushing can increase to 1.5 million ton for the season, done with local capacity.
Table 2: Supply and demand scenarios of soybeans for the 2018/19 season given the current intentions to plant
|
2018/19 |
2018/19 |
2018/19 |
|
|
Scenario 1 |
Scenario 2 |
Scenario 3 |
|
|
*Oppervlakte / Area (x 1000ha) |
720 |
720 |
720 |
|
**Opbrengs / Yield (ton/ha) |
1.48 |
1.75 |
2.3 |
|
***Produksie / Production (x 1000 ton) |
1 066 |
1 260 |
1 649 |
|
(‘000 ton) |
(‘000 ton) |
(‘000 ton) |
|
|
Begin voorraad / Opening stocks |
324 |
324 |
324 |
|
Totale aanbod / Total supply |
1 360 |
1 550 |
1 950 |
|
Total vraag / Total demand |
1 158 |
1 308 |
1 654 |
|
- Gepers (Olie & Oliekoek) / Crushed (Oil & Oilcake) |
950 |
1150 |
1500 |
|
Eindvoorraad / Ending stocks |
202 |
242 |
296 |
|
Pyplyn benodighede / Pipeline requirements (1.5 months) |
145 |
164 |
207 |
|
Surplus bo pynlyn / Surplus above pipeline |
57 |
79 |
89 |
*area planted based on the current CEC’s intentions to plant
**yield is assumptions as discussed above
***Production is calculated by multiplying the area planted by the yields
Table 3 indicate possible supply and demand scenarios of sunflower seed for the 2018/19 season, with a clear indication that if the season’s sunflower seed yields are below average to average given the intentions to plant, an average amount of crushing for oil and oil cake should be sufficient to prevent large carryover stocks at the end of the 2018/19 season. The 3-year average amount of sunflower seeds crushed for oil and oil cake per year is approximately 760 000 ton, which should suffice if Scenario 1 realises, while crushing could increase to 800 000 ton if an average season occur (Scenario 2). If the sunflower yields reach record levels for the season (Scenario 3), increased crushing will be required. The 850 000 tons of sunflower seed crushing is more or less at the higher end of crushing due to fairly limited domestic sunflower oil cake consumption. Generally if the crushing of sunflower seed rise above the 850 000 ton-level, a surplus of sunflower seed oil cake will realise in the market, with possible price pressure as a result.
Table 3: Supply and demand scenarios of sunflower seed for the 2018/19 season given the current intentions to plant
|
2018/19 |
2018/19 |
2018/19 |
|
|
Scenario 1 |
Scenario 2 |
Scenario 3 |
|
|
*Oppervlakte / Area (x 1000ha) |
665.5 |
665.5 |
665.5 |
|
**Opbrengs / Yield (ton/ha) |
1.10 |
1.20 |
1.4 |
|
***Produksie / Production (x 1000 ton) |
732 |
799 |
932 |
|
(‘000 ton) |
(‘000 ton) |
(‘000 ton) |
|
|
Begin voorraad / Opening stocks |
221 |
221 |
221 |
|
Totale aanbod / Total supply |
923 |
990 |
1 116 |
|
Total vraag / Total demand |
776 |
816 |
866 |
|
- Gepers (Olie & Oliekoek) / Crushed (Oil & Oilcake) |
760 |
800 |
850 |
|
Eindvoorraad / Ending stocks |
147 |
174 |
250 |
|
Pyplyn benodighede / Pipeline requirements (1.5 months) |
97 |
102 |
108 |
|
Surplus bo pynlyn / Surplus above pipeline |
50 |
72 |
142 |
*area planted based on the current CEC’s intentions to plant
**yield is assumptions as discussed above
***Production is calculated by multiplying the area planted by the yields
In conclusion
It is important to keep in mind that the calculations have been made given the CEC’s current intention to plant for the 2018/19 season and that the actual figures can still change with the progress of the season and changes in actual plantings. The scenarios are a good indication of possible expectations in the market for the coming season. Producers should therefore use the information to facilitate the decision-making processes for the coming season. In short, the figures generally indicate that if yields for the coming season are below average to average (Scenarios 1 to 2), the market should be comfortable with average to slightly above average local consumption of oilseeds but without excessive stock levels at the end of the season. If the season’s yields are average to above average, stock levels will start to increase significantly, resulting in greater export maize surpluses, whilst the oilseed's local consumption will need to increase significantly. The increase for the local consumption of soybeans is definitely a possibility, subject to the system which must be in place at a good pace.
With the recent plant intentions of the National Crop Estimate Committee, it is clear that there is diversification in producers' plans. It is expected that soybean hectares will increase by 25,4%. With the year's expected carry over stock of 236 432 ton, which is just over 2.5 months' stock, there are many questions about whether South Africa can handle an expansion. To answer this, one has to look at the current season and then the possibilities of the coming season.
The past season was a remarkable season for soybeans, as the country produced a record crop far beyond expectations. Not only was it a remarkable record yield averaging 2.29 tons/ha, but also the second largest planting of 573 950 ha. This was obviously beyond the expectations of the market. The drought and the impact on the livestock industry have also clearly revelaed the damage in the animal feed industry. Fewer animals were fed as more producers tried to build herds again. Total livestock consumption domestically has fallen from 11.7 million ton in 2016 to 11.3 million ton in 2017 (expectation). The bird flu, over and above the drought, also had a direct impact on the reduction of feed consumption. Bird flu's biggest impact is when the first lifecycle of birds have to be eradicated. It took place in the 2017 season and had a remarkable impact on animal feed, especially on laying hens. Apart from the impact on the feed, a crushing plant, which has a relatively large share in the oilseed market, also experienced problems, and crushing figures were below normal in the first half of the season.
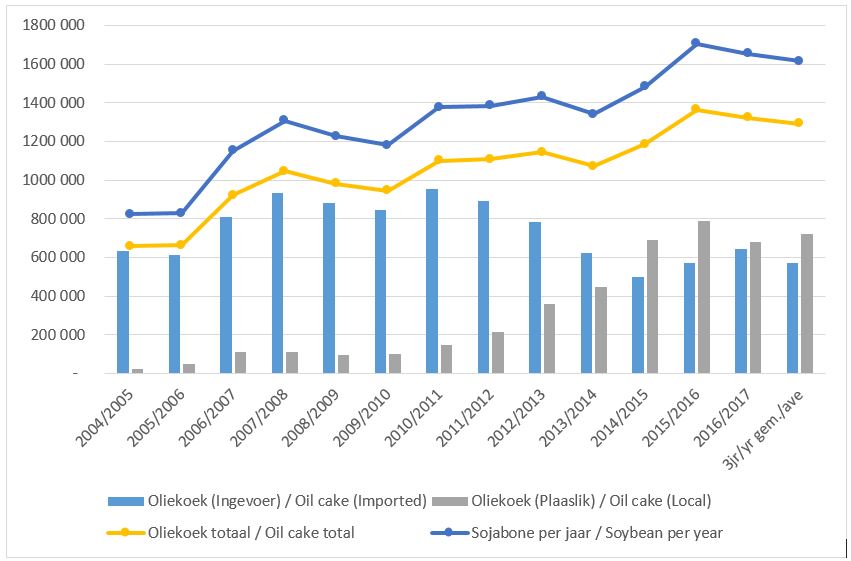
The current season's record soybean production placed pressure on local soybean prices and market prices traded for a short period, close to export parity. When analysing the demand for soybeans, it is also important to take into consideration the products derived from soybean processing. This makes the analysis of oilseed markets somewhat more complex compared to other commodities. The two main products derived are soybean oil cake and full fat soybean, which serves as an important raw material in the animal feed industry, as well as soybean oil, which is largely incorporated into the food industries. Graph 1 indicate the annual amount of soybean oil cake produced locally, as well as imports of oil cake over the past 13 years. This is a good indication of the average demand for soybean oil cake in the local market and is shown in the total column for oil cake. The soybeans per year line indicate the average amount of soybeans that can be crushed per year, to provide for local oil cake consumption without the need to import. The average consumption of soybean oil cake over the past three years is approximately 1.3 million ton and is also shown in Graph 1. The average local production of this, was approximately 720 000 ton, while imports amounted to about 580 000 ton where certain local feed producers (major market players) still prefer to use the imported oilcake. Over the last three seasons, this has decreased as shown in Graph 1. Manufacturers are switching to local oilcake. As soon as local consumers use only local oilcake and not import it will open a large portion of the market for further expansion in terms of production. Thus around 1.6 million ton raw soybeans can be crushed locally to fill the local soybean oil cake market without having to import.
 Graph 1
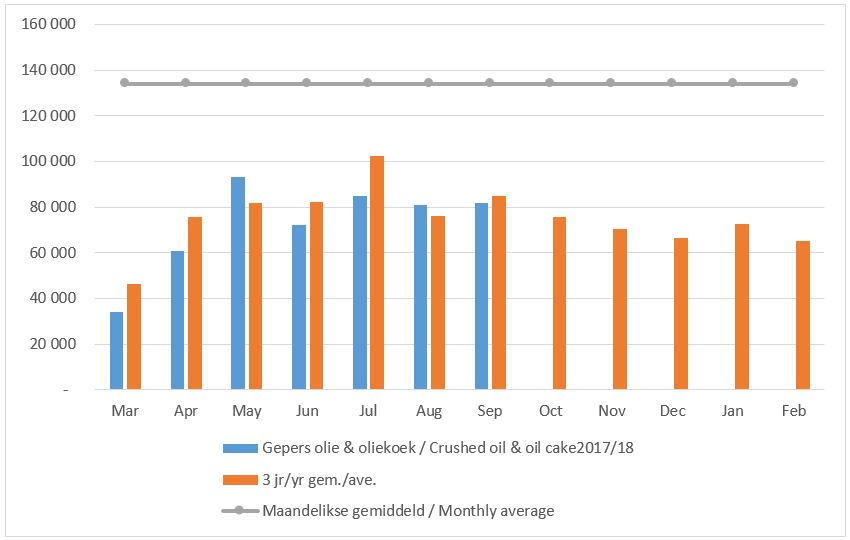
Graph 2 indicate the monthly processing of soybeans crushed for oil and oil cake for the current season, versus the average monthly rate of the past three years. The average monthly processing for the season thus far is slightly lower than the three-year average and with the large production seen this season in the local market and the current rate of processing, there may be a larger than initially expected transfer stock at the end of the marketing season. The local crushing margin was in the previous season continuously negative for a couple of months and the pace was also lower than normal during this period. However, the crushing margin has improved considerably, which supports the volume of crushing. With the current crush margin, it is expected that the crush tempo should be relatively acceptable for the rest of the season - which will support the demand for soybeans. The average monthly processing rate required to reach soybean oil cake levels of approximately 1.3 million tons per year, amounts to approximately 134 000 tons per month as indicated by the monthly average line in Graph 2. The current average crushing rate per month is approximately 75 000 tonnes.
 Graph 2
Please read the Groundnut newsletter, which discusses and explains various aspects of the groundnut market, and largely deals with the grading of groundnuts and groundnut market information. The grading of groundnuts is divided into two sections that explains the reasoning for degree differences e.g. a Selection 1 and Selection 2 versus just a Selection, and the reason for a Crush 1 and 2 degree versus only a Crush degree.
The increase in the bulk handling of groundnuts, necessitated grading and moisture loss at a higher moisture content. Neels Wegner of PPECB, with the help of funding from OPOT, undertook a project to help with the grading of wet groundnuts. Although the project is only in its first year, the first year's results should already be an extra tool in order to make wet, loose gradings more transparent.
The market information places the groundnut market in more perspective regarding stock levels, production and consumption of groundnuts. The supply and demand situation indicate an average consumption of groundnuts locally amounts to approximately 65 000 ton, indicating that it is a relatively small market. Producers who decide to plant groundnuts in the coming season must, however, take into account several factors this season and an aspect such as good marketing will be necessary. With the limited domestic consumption, the market can easily move into an excessive production situation which causes the need to export surpluses, placing local prices under pressure. Producers should therefore strongly consider looking at aspects such as pre-season contracts with the production of groundnuts.
Download the full newsletter here
Grain SA staff supported the awareness campaign #BlackMonday that kicked off on Monday, 30 October 2017. "Grain SA supports the peaceful protest against violent crimes on farms. We would also like to express our sympathy to everyone who has been negatively impacted by this. Grain SA dreams of a country where there is a mutual respect for lives, regardless of race or gender. Every human being's right to life is protected by our Constitution. with South Africans expressing their support by wearing black", CEO, Jannie de Villiers stated.