- Follow us:
- Our Commodities:
-
Wheat blast is a fungal pathogen caused by Magnaporthe oryzae pathotype Triticum (MoT). MoT is a prolific fungal pathogen that is commonly associated warm-humid regions. Wheat blast was contained in South America since its first detection in Brazil in 1985, however, more recently it has been detected in Bangladesh (2016) and Zambia (2018). The report of wheat blast in Zambia is the first reported case of the disease on the African continent.
Wheat Blast directly affects the wheat head and targets the grain, which is seen as bleaching of the spikes as well as small, shrivelled seeds. Wheat Blast symptoms are similar to those of Fusarium Head Blight.
With the first report of wheat blast confirmed in Africa, it is important for producers to remain vigilant, particularly in the irrigation regions.
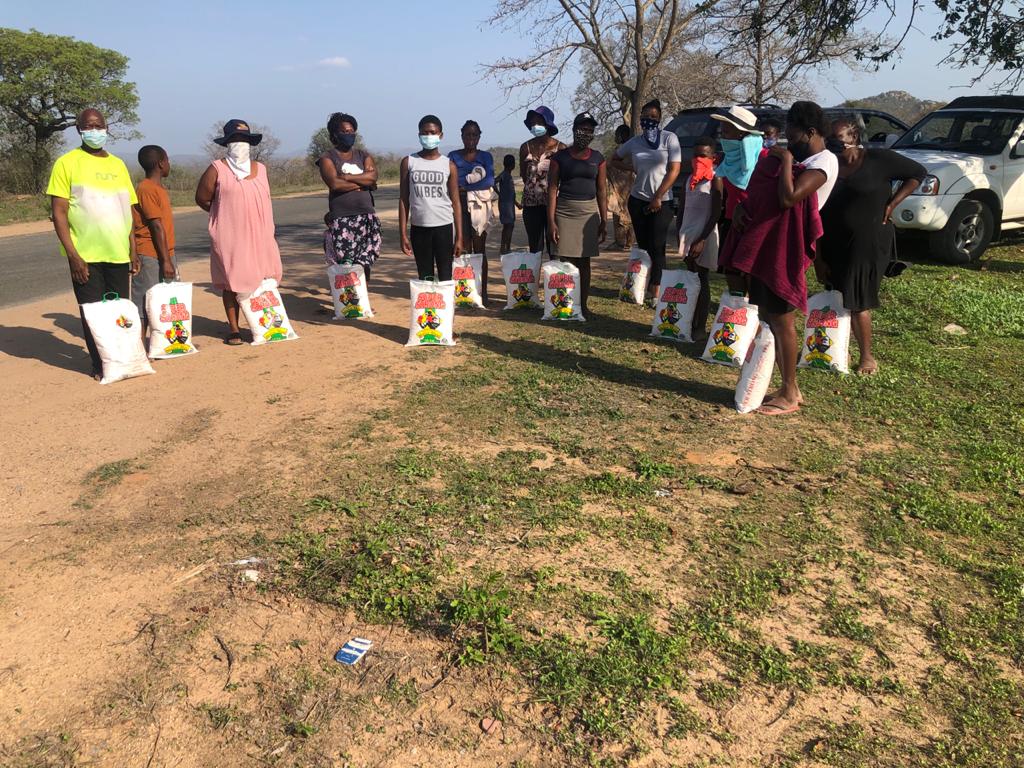
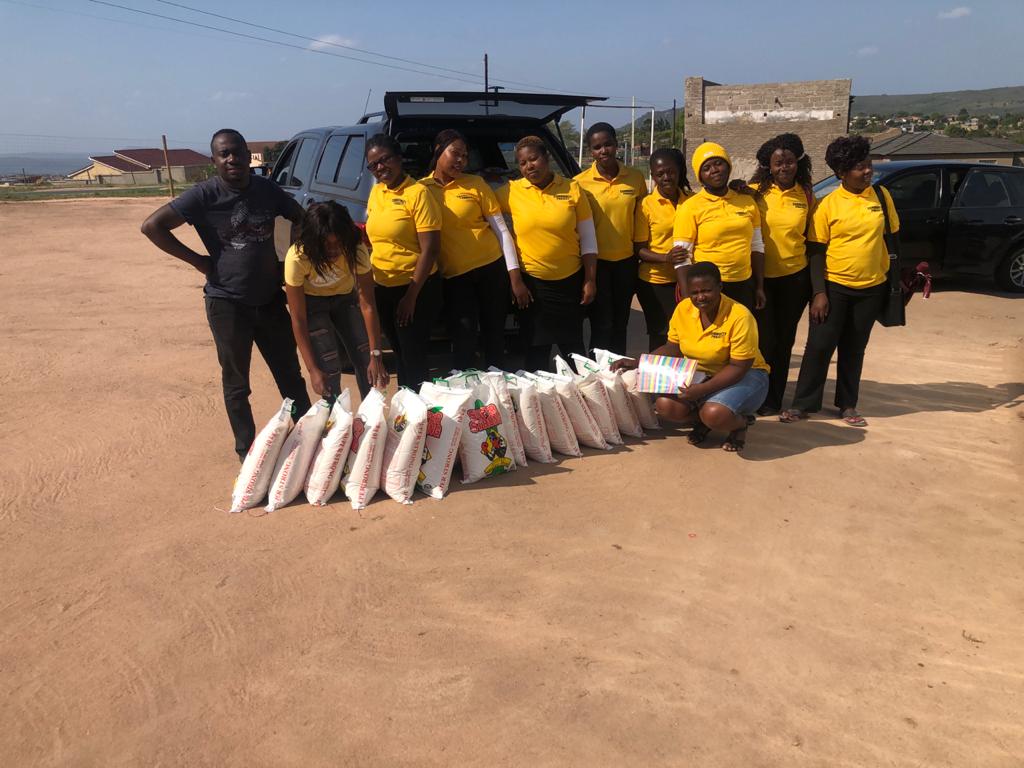
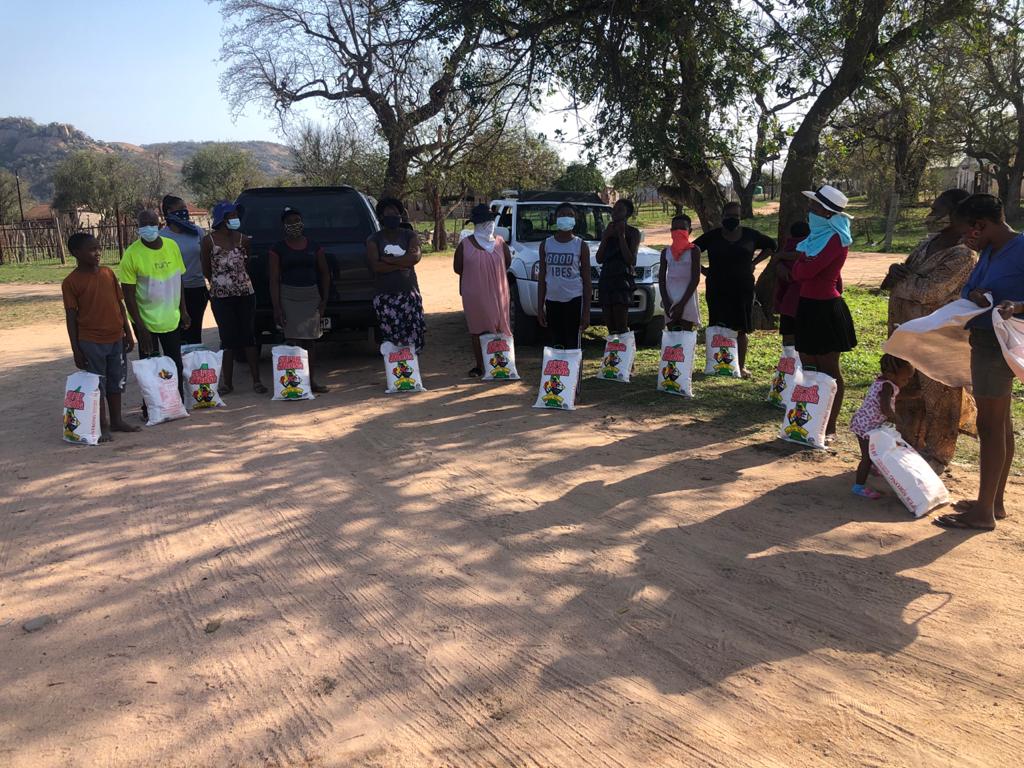
From June 2020 until October 2020, Grain SA, in cooperation with TWK Piet Retief donated and distributed 1,000 10kg bags of maize meal within Mpumalanga to members of communities, church organisations, people with disabilities, the elderly and orphanage centres severely affected by the COVID-19 pandemic.
The beneficiaries have been overjoyed and humbled by this gesture and were appreciative of the help to feed their families during prevailing difficult times, as they have been unable to work since the start of the pandemic
|
|
|
|
|
|
|
Members of Kanyamazane Pentecostal Holiness Church who |

Grain SA last week hosted the first Grow for Gold National Yield Competition in Muldersdrift, celebrating 46 producers across 16 categories for outstanding yields achieved with maize, soybean and sunflower crops across South Africa, from commercial to small-scale farmers. With the support of event sponsor Pioneer, supported by Corteva, this prestigious event created synergy between individual seed companies’ regional yield competitions setting the bar high for future seasons.
Grain producers competed in various categories, including dry and irrigated land both regionally and nationally. In order to achieve the highest yields per hectare, regardless of the cultivar planted, innovative production practices and smart farming plans were vital to their success.
If you missed the Awards Ceremony, watch a reply on the link below.
Also keep an eye out on the November issue of SA Graan/Grain for more coverage of the Awards Ceremony.
It has been seven months since COVID-19 hit the shores of South Africa, during which period the country has been under restrictions to curb the spread of the disease. Over the past month the country has slowly opened up and the economy is starting to pick up. As with many emerging market currencies, the rand took a knock against the dollar and remains weak, while brent crude oil also remained low due to a depressed demand globally. All these factors had an effect on the chemical and fertilizer prices.
Tables 1 to 4 indicate trends in the prices of international agricultural chemicals (active ingredients) for a year and over a monthly period in both dollar and comparable rand-values. Year-on-year, the rand depreciated by 12.6%, while on a month-to-month basis appreciated by 3%. The impact of the rand/dollar exchange is indicated in each table.
|
|
International Insecticide prices: |
International Insecticide prices: |
||||
|
Sep-19 |
Sep-20 |
% change |
Sep-19 |
Sep-20 |
% change |
|
|
USD/t |
USD/t |
% |
R/t |
R/t |
% |
|
|
Imidacloprid (95%) |
19 357 |
12 932 |
-33,2 |
287 255 |
216 097 |
-24,8 |
|
Lambda-cyhalothrin (95%) |
38 564 |
25 353 |
-34,3 |
572 291 |
423 646 |
-26,0 |
|
Carbofuran (99%) |
15 241 |
14 636 |
-4,0 |
226 176 |
244 565 |
+8,1 |
|
Deltamethrin (98%) |
85 210 |
80 953 |
-5,0 |
1 264 520 |
1 352 723 |
+7,0 |
|
Acetamiprid (95%) |
21 278 |
14 352 |
-32,5 |
315 758 |
239 820 |
-24,0 |
|
Chlorpyrifos (95%) |
6 666 |
7 255 |
+8,8 |
98 928 |
121 239 |
+22,6 |
|
Cypermethrin (94%) |
14 281 |
13 302 |
-6,9 |
211 924 |
222 269 |
+4,9 |
|
R/$ |
14,84 |
16,71 |
12,6 |
|
||
Source: Grain SA
*Data as at September 2020
Based on monthly data, international insecticide prices (Table 2) indicate an increasing trend for most of the insecticides in dollar-terms except Chlorpyrifos which rose by about 0.2%, but a different trend in rand terms is observed, with an increase of between 0.9% and 3.2% for all chemicals, except Deltamethrin which rose minimally by 0.8%.
|
|
International Insecticide prices: |
International Insecticide prices: |
||||
|
Aug-20 |
Sep-20 |
% change |
Aug-20 |
Sep-20 |
% change |
|
|
USD/t |
USD/t |
% |
R/t |
R/t |
% |
|
|
Imidacloprid (95%) |
12 936 |
12 932 |
+0,0 |
222 892 |
216 097 |
-3,0 |
|
Lambda-cyhalothrin (95%) |
24 816 |
25 353 |
+2,2 |
427 578 |
423 646 |
-0,9 |
|
Carbofuran (99%) |
14 326 |
14 636 |
+2,2 |
246 835 |
244 565 |
-0,9 |
|
Deltamethrin (98%) |
77 898 |
80 953 |
+3,9 |
1 342 184 |
1 352 723 |
+0,8 |
|
Acetamiprid (95%) |
14 326 |
14 352 |
+0,2 |
246 835 |
239 820 |
-2,8 |
|
Chlorpyrifos (95%) |
5 919 |
5 905 |
-0,2 |
101 976 |
98 666 |
-3,2 |
|
Cypermethrin (94%) |
13 288 |
13 302 |
+0,1 |
228 952 |
222 269 |
-2,9 |
|
R/$ |
17,23 |
16,71 |
-3,0 |
|
||
Source: Grain SA
*Data as at September 2020
Yearly herbicide prices (Table 3) show a general increase in the prices of all active ingredients except Atrazine and Metolachlor with a decrease in dollar terms. In rand terms a similar trend is observed, although prices indicate higher increases of about 11 to 30% year-on-year, except for Atrazine, minorly decreasing. The increases in rand terms can be attributed to the weaker Rand.
|
|
International herbicide prices: |
International herbicide prices: |
||||
|
Sep-19 |
Sep-20 |
% change |
Sep-19 |
Sep-20 |
% change |
|
|
USD/t |
USD/t |
% |
R/t |
R/t |
% |
|
|
Glyphosate (95%) |
3 569 |
3 791 |
+6,2 |
52 968 |
63 353 |
+19,6 |
|
Acetochlor (92%) |
3 033 |
3 065 |
+1,1 |
45 012 |
51 219 |
+13,8 |
|
Atrazine (97%) |
3 075 |
2 483 |
-19,3 |
45 640 |
41 488 |
-9,1 |
|
Metolachlor (97%) |
3 315 |
3 278 |
-1,1 |
49 199 |
54 777 |
+11,3 |
|
Trifluralin (95%) |
5 576 |
6 454 |
+15,8 |
82 741 |
107 851 |
+30,3 |
|
R/$ |
14,84 |
16,71 |
12,6 |
|
||
Source: Grain SA
*Data as at April 2020
Monthly herbicide prices between August and September 2020 (Table 4) display an increasing trend except for Trfluralin. The same prices in rand terms, show a general decrease except for Glyphosate. The decreases in rand terms can be attributed to a short-term strengthening rand.
|
|
International herbicide prices: |
International herbicide prices: |
||||
|
Aug-20 |
Sep-20 |
% change |
Aug-20 |
Aug-20 |
% change |
|
|
USD/t |
USD/t |
% |
R/t |
R/t |
% |
|
|
Glyphosate (95%) |
3 408 |
3 791 |
+11,2 |
58 722 |
63 353 |
+7,9 |
|
Acetochlor (92%) |
3 000 |
3 065 |
+2,2 |
51 694 |
51 219 |
-0,9 |
|
Atrazine (97%) |
2 430 |
2 483 |
+2,2 |
41 873 |
41 488 |
-0,9 |
|
Metolachlor (97%) |
3 278 |
3 278 |
+0,0 |
56 483 |
54 777 |
-3,0 |
|
Trifluralin (95%) |
6 586 |
6 454 |
-2,0 |
113 471 |
107 851 |
-5,0 |
|
R/$ |
17,23 |
16,71 |
-3,0 |
|
||
Source: Grain SA
*Data as at April 2020
Figure 1 depicts international fertilizer prices in dollar terms from September 2019 until September 2020 as well as rand/dollar exchange, for the same period. Looking at the past year, there is a general increase in international fertilizer prices, except for potassium chloride which shows a significant decrease of 36.1%. Ammonia, Urea and DAP decreased by 5.5%, 15.3% and 6.6% respectively.
|
|
International Fertilizer Prices: |
International Fertilizer Prices: |
||||
|
Sep-19 |
Sep-20 |
% change |
Sep-19 |
Sep-20 |
% change |
|
|
USD/t |
USD/t |
% |
R/t |
R/t |
% |
|
|
Ammonia (Middle East) |
235 |
248 |
+5,5 |
3487 |
4144 |
+18,8 |
|
Urea (46) (Eastern Europe) |
235 |
271 |
+15,3 |
3487 |
4528 |
+29,9 |
|
DAP (USA Gulf) |
319 |
340 |
+6,6 |
4734 |
5681 |
+20,0 |
|
KCL (CIS) |
324 |
207 |
-36,1 |
4808 |
3459 |
-28,1 |
|
Rand/Dollar exchange rate |
14,84 |
16,71 |
+12,6 |
|
||
Source: Grain SA
*Data as at September 2020
Figure 6 illustrates average domestic fertiliser prices in rand terms since 2019 January. Local fertilizer prices between October 2019 and October 2020 indicate a general fluctuation of prices; whcih can be attributed to the COVID-19 pandemic, the exchange rate and uncertainty of international supply chains, especially earlier on in the year. A drop in prices around February and March 2020 are observed, with upward movement from May to October, except for potassium chloride, which showed a downward trend since May.

Figure 1: Local fertilizer prices
Source: Grain SA
*Data as at October 2020
As the world tries to rebuild economies amid the ongoing pandemic, things have settled down a bit as supply chains and logistics companies get into the habit of doing business according to the new normal. Although the pressure is off, all eyes remain on major chemical and fertilizer suppliers and their management of the pandemic and mitigation of a second wave of COVID-19. In the short term, prices are expected to move sideways unless if there are any major occurances. Lower brent crude oil prices have also helped in maintaining low input prices. For South Africa the exchange rate remain the key factor to keep an eye on.
South Africa’s plastic recyclers were severely hampered by the lockdown regulations and ceased operations for the better part of three months. The market has fortunately recovered, and plastic recycling is in full swing again. This, however, has created such a demand for recycled plastic that most of the CropLife SA certified plastic recyclers are desperate for triple rinsed, punctured empty HDPE pesticide containers. Pesticide containers need to be triple rinsed to remove virtually all the pesticide residues to render the containers nominally empty according to SA National Standard 10406.
CropLife SA appeals to South African farmers to triple rinse all empty pesticide containers, puncture them and arrange to be dropped off at a CropLife SA certified plastic recycler.
Details about the triple rinsing of empty containers, requirements for collectors and recyclers, compliance issues and the list of CropLife SA certified recyclers are available on www.croplife.co.za.
Successful crop production largely depends on the correct and proper applications of production inputs that will minimise the cost of these inputs and sustain the natural resources and the environment. The inputs for maize production generally include the available mechanisation tools, soil tillage option, crop rotation, adapted cultivars, plant population, fertilisation, weeding, insect and disease control and harvesting. Careful planning for each of the inputs that are necessary and the applications thereafter should be considered before planting or even after last season’s harvesting.
Refer to the 2020 Grain Guide (pages 17-19) for more detail here