- Follow us:
- Our Commodities:
-
Recent widespread rainfall that has occurred over the largest grain producing areas is of great value to the summer grain crops, which are in an important stage of the growth cycle. According to experts, recent rains have reduced the chances of very low temperatures and the prevalence of frost, and frost is expected to occur only in late April in central areas. However, the prevailing cooler and cloudy conditions are currently slowing down crop growth. Producers in the eastern part of the country want to start harvesting soybeans but the wet conditions is hindering the harvesting process.
Click the image below for full screen view.
Fuel prices for May 2019
According to the latest information from the Central Energy Fund, diesel prices may decrease with 4 cents per litre on 1 May, while the petrol price may increase by 56 cents per litre. The wholesale price of diesel in Gauteng currently cost R14.95 per litre, which is 17.23% higher compared to the same time last year.
Fertiliser price trends
International versus local fertiliser price trends:
Since more than 80% of South Africa’s fertiliser needs has to be imported, international price trends can be used to predict domestic price movements. Internationally, prices have been used in certain ports while domestically average prices of various fertiliser companies are used. The intent is to capture comparative year-on-year trends rather than on the physical price.
Table 1 indicate global price trends in dollar terms, while Table 2 shows the same prices in rand value. In international markets, prices of ammonia, urea and DAP have decreased in dollar terms over the year-period, whilst the price of potassium chloride increased. The rand has, over the same period, weakened by 13.1%, which should be unfavourable for imported fertilisers. Table 2 indicate a clear increased value in rand in terms of international fertiliser prices due to the weaker exchange.
|
Table 1: International fertiliser prices in dollar value |
|||
|
|
March 2018 |
March 2019 |
% change |
|
Fertiliser |
Dollar/ton |
Dollar/ton |
% |
|
Ammonia (Middle-East) |
287 |
256 |
-10.8 |
|
Urea (46) (Eastern Europe) |
234 |
224 |
-4.3 |
|
DAP (US Golf) |
412 |
385 |
-6.6 |
|
KCL (CIS) |
250 |
280 |
+12.0 |
|
Rand/Dollar exchange |
11,83 |
13,38 |
13,1 |
|
Table 2: International fertiliser prices in rand value |
|||
|
|
March 2018 |
March 2019 |
% change |
|
Fertiliser |
Rand/ton |
Rand/ton |
% |
|
Ammonia (Middle-East) |
3 395 |
3 425 |
+0,9 |
|
Urea (46) (Eastern Europe) |
2768 |
2997 |
+8 |
|
DAP (US Golf) |
4874 |
5151 |
+6 |
|
KCL (CIS) |
2958 |
3746 |
+27 |
Table 3 indicate how local fertiliser price trends moved over a year-period. The table indicate that with the exception of KAN, local prices increased with more than 10% over the year-period.
|
Table 3: Domestic fertiliser prices |
|||
|
|
April 2018 |
April 2019 |
% change |
|
Fertiliser |
Rand/ton |
Rand/ton |
% |
|
KAN (28) |
4808 |
4803 |
-0,1 |
|
Urea (46) |
5631 |
6205 |
+10,2 |
|
MAP |
8394 |
9313 |
+10,9 |
|
KCL |
6307 |
7263 |
+15,2 |
INTERNATIONAL AGRICULTURE CHEMICAL PRICE TRENDS
Essentially 100% of the active ingredients needed to manufacture agricultural chemicals are imported. International trends and the exchange rate will therefore play a decisive role in domestic pricing.
Tables 1 to 4 indicate trends in international agricultural chemicals (active ingredients) prices in a Chinese port. Tables 2 and 4 indicate international prices in rand value. The rand has weakened by 13,1% from March 2018 to March 2018.
As far as herbicides are concerned, except for Trifluralin, all active ingredients show year-on-year increased in rand value.
Table 1: Herbicide prices: International in dollar value
|
International herbicide prices - Year-on-year change ($/t) |
|||
|
|
Mar 18 |
Mar 19 |
% change |
|
USD/t |
USD/t |
% |
|
|
Glyphosate (95%) |
4 206 |
4 886 |
+16.2% |
|
Acetochlor (92%) |
2 588 |
3 983 |
+53.9% |
|
Atrazine (97%) |
2 657 |
3 686 |
+38.7% |
|
Metolachlor (97%) |
3 373 |
4 415 |
+30.9% |
|
Trifluralin (95%) |
4 516 |
4 585 |
+1.5% |
|
R/$ |
13.56 |
12.18 |
-10.2% |
Table 2: Herbicide prices: International in rand value
|
International herbicide prices - Year-on-year change (R/t) |
|||
|
|
Mar 18 |
Mar 19 |
% change |
|
R/t |
R/t |
% |
|
|
Glyphosate (95%) |
51 334 |
55 073 |
+7,3 |
|
Acetochlor (92%) |
47 402 |
46 408 |
-2,1 |
|
Atrazine (97%) |
44 677 |
46 462 |
+4,0 |
|
Metolachlor (97%) |
53 517 |
49 104 |
-8,2 |
|
Trifluralin (95%) |
56 488 |
70 189 |
+24,3 |
When reviewing insecticide prices, the most actives indicate sharp rising trend in dollar as well as in rand values. According to Chinese market reports, the state implements very strict pollution legislation, with many plants closing as a result. This has greatly reduced the supply of insecticides and pushed prices upwards. Sharp rises are expected in the domestic market in March 2018. It is important to take note that many of the multi-national companies' products are not imported from China, and therefore would not show similar increases.
Table 3: Insecticide prices: International in dollar value
|
International insecticide prices - Year-on-year changes ($/t) |
|||
|
|
Jan 17 R/t |
Jan 18 R/t |
% change |
|
Imidacloprid (95%) |
17 621 |
32 162 |
+82.5% |
|
Lambda-cyhalothrin (95%) |
20 996 |
36 890 |
+75.7% |
|
Carbofuran (99%) |
9 333 |
13 193 |
+41.4% |
|
Deltamethrin (98%) |
56 491 |
105 097 |
+86.0% |
|
Acetamiprid (95%) |
18 840 |
32 595 |
+73.0% |
|
Chlorpyrifos (95%) |
4 348 |
7 154 |
+64.5% |
|
Cypermethrin (94%) |
9 655 |
18 002 |
+86.5% |
|
R/$ |
13.56 |
12.18 |
-10.2% |
Table 4: Insecticide prices: International in rand value
|
International insecticide prices - Year-on-year changes (R/t) |
|||
|
|
Jan 17 R/t |
Jan 18 R/t |
% change |
|
Imidacloprid (95%) |
239 648 |
391 734 |
+63.5% |
|
Lambda-cyhalothrin (95%) |
285 548 |
449 319 |
+57.4% |
|
Carbofuran (99%) |
126 922 |
160 693 |
+26.6% |
|
Deltamethrin (98%) |
768 279 |
1 280 085 |
+66.6% |
|
Acetamiprid (95%) |
255 471 |
397 001 |
+55.4% |
|
Chlorpyrifos (95%) |
58 965 |
87 132 |
+47.8% |
|
Cypermethrin (94%) |
130 916 |
219 261 |
+67.5% |
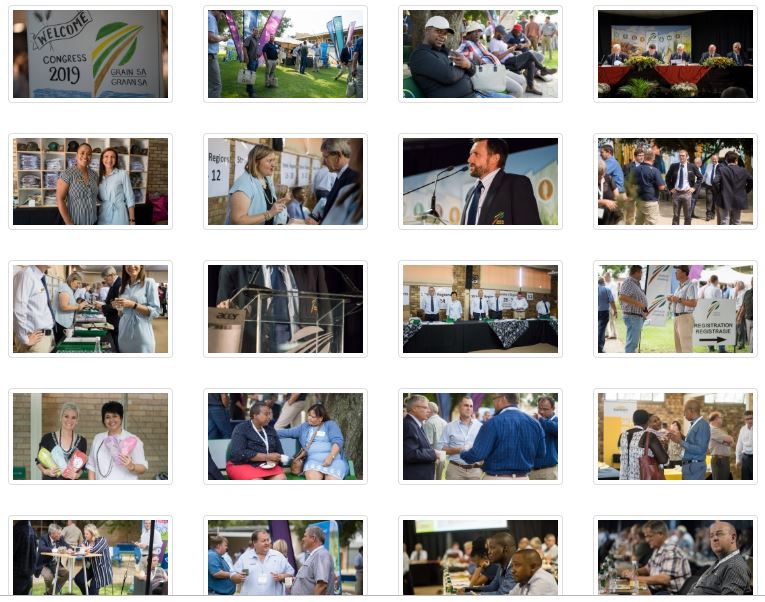
If you missed the Grain SA Congress, be sure to have a look at the photo gallery on our website. Follow the link below:
To download a copy of the Annual Report, click on the link below:
Grain SA would like to congratulate the Chairperson, Vice-chairpersons and newly elected Executives with their appointments. We wish you well in your tenure and look forward to your contribution in organised agriculture. Our newly elected members are:
|
The Sandy Soils Development Committee is hosting a Farmer's Day on 1 May 2019. Details as follows:
Time:
08h00 for 08h30
Venue:
Humansvlakte Skool (R59 Bothaville-Hoopstad teerpad)
Topics:
Plant density, rip depth, crop rotation and many more
Speakers:
Danie Minnaar, Louwrens van der Linde, Thabo van Zyl & Kobus van Zyl
RSVP:
Before 29 April 2019 to Nadia on 083 233 7539

Remember that members will only be able to access their 2019 NAMPO tickets directly from their Grain SA digital membership cards. Your membership card will utilise smart technology and afford us the opportunity to communicate smarter, directly and more cost-effective.
If you have not downloaded your membership card yet, do so without delay from your APP Store.

Use your cellphone number to access your Grain SA Digital membership card,
search for the JOYN APP on Google Play Store or on the Apple App Store
To download a copy of the User Journey, with all the information and features
CLICK HERE
For any queries and/or assistance, contact Elray at Grain SA on 08600 GRAIN (47246) or e-mail members@grainsa.co.za