- Follow us:
- Our Commodities:
-
January 2019
The World Trade Organisation (WTO) is an organisation for liberalising trade among 159 developed and developing countries across the globe; it operates a global system for trade rules, acts as a forum for negotiating trade agreements and settles disputes between members.
According to the WTO, there are different ‘boxes’ in which domestic support can be categorised:
It is just unfortunate that most countries have reduced the amber box; however, the green and blue boxes keep growing, therefore putting those without any support at a disadvantage.
The USA is one of the world’s leaders in grain production, ranked as the first largest producer of maize, producing an annual average of 360 million tons of maize and 114 million tons of soybeans. As a country that also gains from export subsidies, the USA is also ranked as one of the major exporters of grain, with a wide destination spanning across developed and least developed countries.
Over the years, least developed nations have been hurt by exports that come from countries that have sufficient government support. It is against this background that this article seeks to uncover the underlying effects of the USA subsidies on developing countries as well as the benefit that those producers gain from this range of support.
Agricultural support according to OECD
Agricultural policies are measures related to the domestic farm sector and trade in agricultural products. These policies are meant to address a wide range of issues, including providing sufficient food at reasonable prices for consumers, ensuring food safety and improving environmental quality.
The Organisation for Economic Co-operation and Development (OECD) has developed agriculture support indicators that, despite this diversity, express policy measures with numbers in a comparable way across time and between countries.
 Agricultural support is defined as the annual monetary value of gross transfers to agriculture from consumers and taxpayers, arising from governments’ policies that support agriculture, regardless of their objectives and their economic impacts. The Percentage Total Support Estimate indicator (%TSE) represents the total of policy transfers to the agricultural sector expressed as a share of Gross Domestic Product (GDP). The Percentage Producer Support Estimate (%PSE) represents policy transfers to agricultural producers, measured at the farm gate and expressed as a share of gross farm receipts.
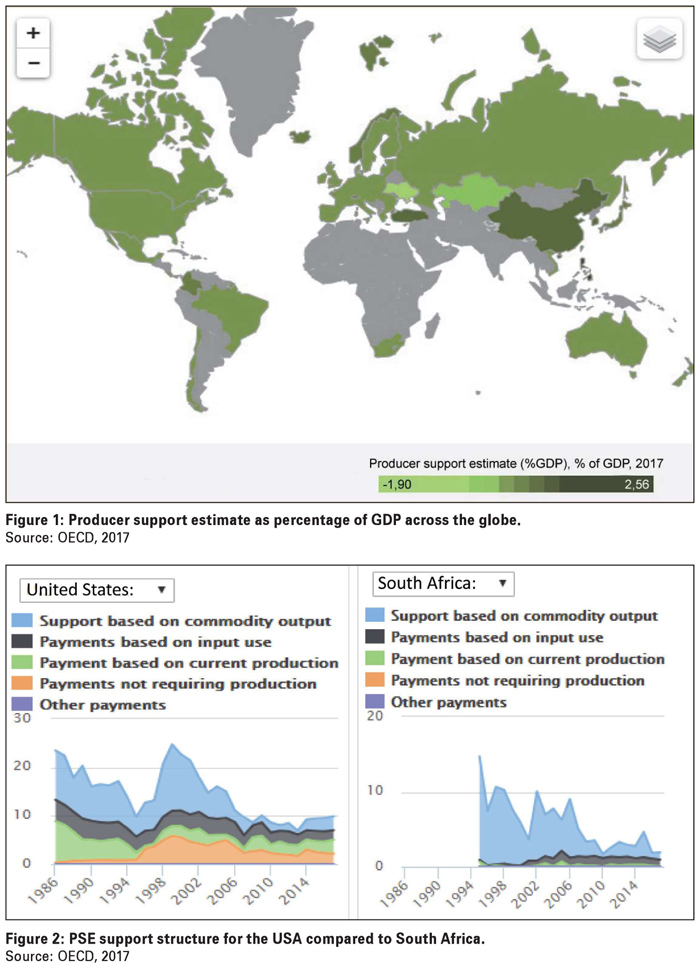
Total Support Estimate transfers consist of transfers to agricultural producers (measured by the Producer Support Estimate), consumers (measured by the Consumer Support Estimate) and support to general services to agricultural sector (measured by the General Service Support Estimate). Transfers included in the Producer Support Estimate are composed of market price support, budgetary payments and the cost of revenue foregone by the government and other economic agents (Figure 1).
Figure 2 depicts a breakdown of agricultural support for the USA compared to South Africa over the years. It is clear from the figure that support in South Africa has always been minimal compared to the USA and has decreased significantly over the years.
Producer protection according to OECD
Producer protection, measured by the Producer Nominal Protection Coefficient (NPC) is defined as the ratio between the average price received by producers (measured at the farm gate), including net payments per unit of current output, and the border price (measured at the farm gate).
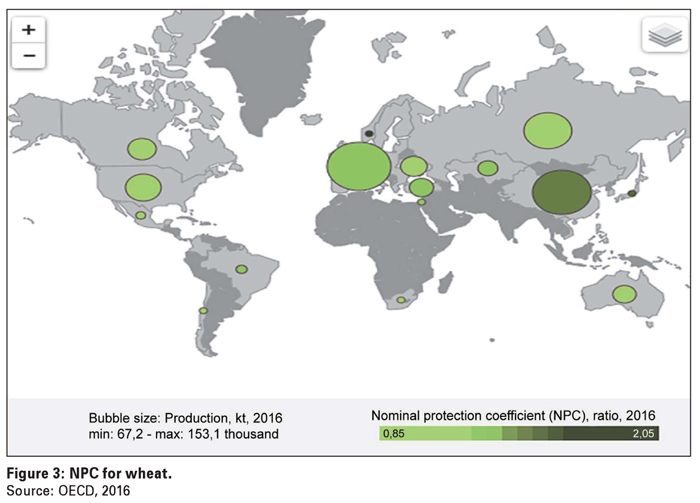 The NPC scale for wheat ranges from 0,85 to 2,05 (Figure 3). For instance, an NPC of 1,10 suggests that producers, overall, received prices that were 10% above international market levels. South Africa has an NPC of 1,00 for wheat, meaning it does not receive any support for the commodity, while the USA has an NPC of 1,01 for wheat, meaning that it receives prices that are 1% above the international market level.
Bubble size represents production in kt (a unit of count defining the number of kits/barrels for grain) for the year 2016, with the minimum being 67,2 thousand and maximum 153,1 thousand.
How do USA farm subsidies work
The USA government spends more than $20 billion a year on subsidies for farm businesses. About 39% of the 2,1 million farms receive subsidies, with the biggest portion going towards maize, soybean, wheat, cotton and rice. These subsidies are meant to protect producers against fluctuations in prices, revenues and yield. They subsidise their conservation efforts, insurance coverage, marketing, export sales, research and other activities; government aid is deep and comprehensive.
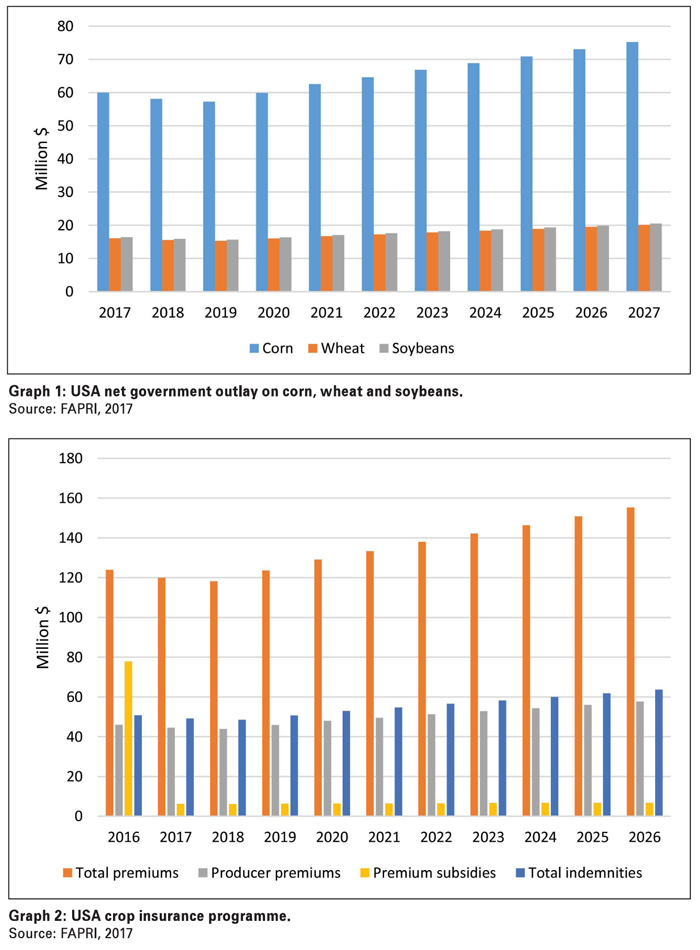 Graph 1 depicts USA government spending on corn (maize), wheat and soybeans from 2017/2018 and shows an outlook of what will be spent for the next ten years.
Farming operations have been receiving assistance from as early as 1862, with most systems evolving over time to date.
All these subsidies ensure that farm incomes are much higher than the incomes of most Americans, inducing overproduction, inflating land prices and harming the environment. The Trump administration has decided to cut down farm subsidies for 2019, by imposing limits on the maximum payments to each producer and ending subsidies for producers earning above $500 000 a year.
Eight types of farm subsidies in the USA
Insurance
The government crop insurance programme is one of the largest support programmes for producers. It helps to protect agricultural producers from losses due to low crop yields or lower than expected crop prices. This programme cost the government about $5 billion in 2016 and nearly $9 billion annually over a five-year period (Graph 2).
Agricultural risk coverage
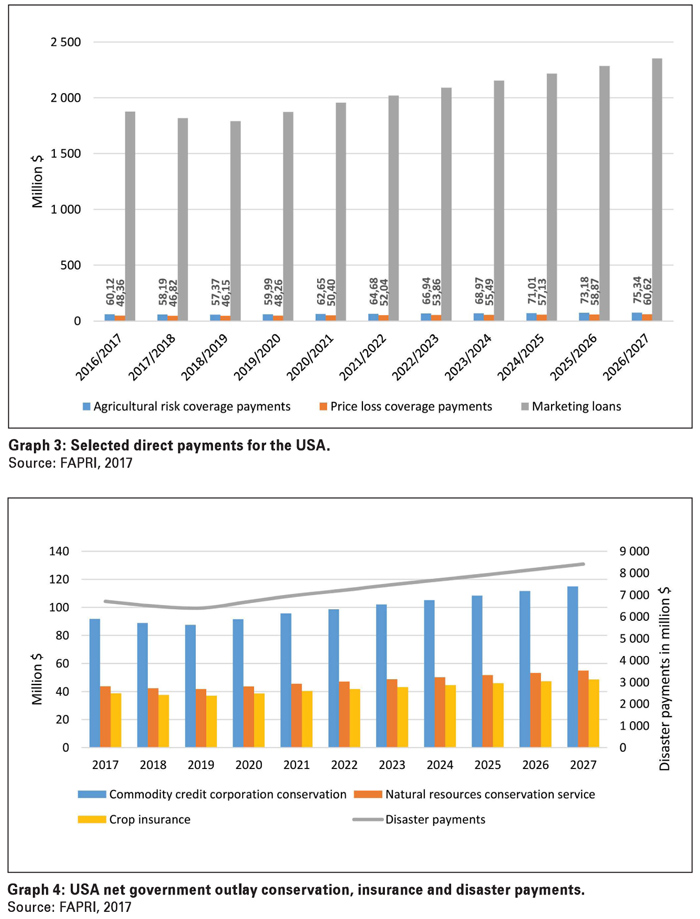
This programme works according to a benchmark or guaranteed level. Producers get subsidies if their revenue per acre or alternatively their county’s revenue per acre falls below the set amount. In general, the lower the prices and the revenue, the higher the subsidies. The pay-out for this programme was about $3,2 billion in 2017, covering more than 20 crops (Graph 3).
 Price loss coverage
With this programme subsidies are paid to producers based on national average price of crop – compared to the crop’s reference price as set by congress. The larger the fall in a crop’s national price below its reference price, the larger the pay-out to producers. Pay-outs are almost guaranteed since reference prices are set high. Payments for this programme were $3,2 billion in 2017, covering more than 20 crops (Graph 3).
Producers have the choice to participate in either agricultural risk coverage or price loss coverage. At the same time, they can enrol in crop insurance, the general function being to keep farm income high.
Marketing loans
This price-guarantee programme began during the New Deal. The original idea was to give producers a loan at harvest time so that they could hold their crops to sell at a higher price later.
The cost of this programme dropped to near zero in 2017, but it was about $160 million in each of the previous two years (Graph 3).
Conservation programmes
The United States Department of Agriculture (USDA) runs numerous farm conservation programmes, which costs more than $5 billion a year (Graph 4).
Programmes pay producers for things like improving land in production or taking land out of production.
Disaster aid
The government operates disaster aid programmes for various types of producers, from wheat growers to livestock producers to orchard operators. In addition to disaster programmes already in law, congress often distributes more aid after adverse events. Disaster aid amounts fluctuate, but such aid has averaged $1,9 billion a year since 2010 (Graph 4).
Marketing and export promotion
The Agricultural Marketing Service spends $1,2 billion a year on farm and food promotion activities. The Foreign Agricultural Service spends about $300 million a year on marketing activities for USA farm and food products, including operating more than
90 foreign offices.
Research and support
Although most American industries fund their own research and development, the USA government employs thousands of scientists and other experts to aid the agricultural industry.
The USDA spends about $3 billion a year on agriculture and food research at more than 100 locations.
The variety of subsidies in the USA just shows how much support their producers have and the advantage it gives them against other producers in the world who do not receive any support. Subsidies have their advantages and disadvantages and some of the underlying effects of farm subsidies have an impact on the local economy of the country of note and eventually have an impact on trade partners, especially developing ones.
Subsidies undermine trade relations. When a country subsidises farm production and the result thereof is a boost in commodity exports, this undermines foreign producers and distorts global trade patterns. In addition to subsidies, recent USA income tax data over the last years shows that in general farming businesses are lightly taxed.
Conclusion
Although there are inefficiencies caused by subsidies, it is highly unlikely that the USA and other major South African trade partners are willing to remove subsidies in totality considering the benefits for their producers. This means that the South African government needs to use opportunities that are unutilised from the domestic support pillar of the WTO; R2 billion, under the amber box and unlimited support under the blue, green and brown boxes.
These unutilised subsidy options are within the WTO agreement and would afford South African producers a better chance at competing on the international market. What we can learn from the USA is that they prioritise their producers, therefore allowing them to survive within the local economy and to be competitive on the international front.
Budget is always an obstacle for South Africa, but this can always be executed if government commits towards this, and reallocates funds, as they have been promising for years.
Considering the unpredictable weather patterns and production costs in South Africa it would be beneficial for producers to be subsidised on crop insurance and input costs. To avoid inefficiencies, insurance money does not have to be in the form of direct payments; nonetheless, producers will still get the reassurance needed should tragedy strike.
With input costs becoming ridiculously high annually, government can subsidise fertiliser and chemical companies for prices to decrease for the producer. Subsidising producers on crop insurance and input costs would assist South Africa in terms of achieving food security and competing on the world market.
This could also create an opportunity for small scale producers to borrow money from banks against their insurance policy, therefore allowing them to expand their businesses and to create jobs. This might be a process that could happen over time; however, it is high time we start taking lessons from other major producing countries on how to make the agricultural environment better for all producers.
Publication: January 2019
Section: Relevant
