- Follow us:
- Our Commodities:
-
June 2018
The term ‘competitiveness’ is best understood as the ability of a sector, industry, firm or farm to compete by trading their products within the global environment while at least earning the opportunity cost of resources employed. For wheat producers in South Africa, the empirical indicators of competitiveness seemingly tell a depressing story while, on the other hand, depicting wheat millers as sufficiently competitive on global standards.
However, the operating environment within which value chain stakeholders operate either incentivises their business activity or disincentivises it. These operating incentives in turn play a large role in the specific stakeholder’s ability to be competitive.
We are able to quantify these incentives and disincentives through a ‘distortion’ measurement. This is done through comparisons of ‘perfect world’ free market prices and prevailed market prices in the domestic market. Through doing this, the degree to which the policy and operating environment has distorted incentives for individual stakeholders to operate in is able to be determined and quantified.
 Quantifying distortions
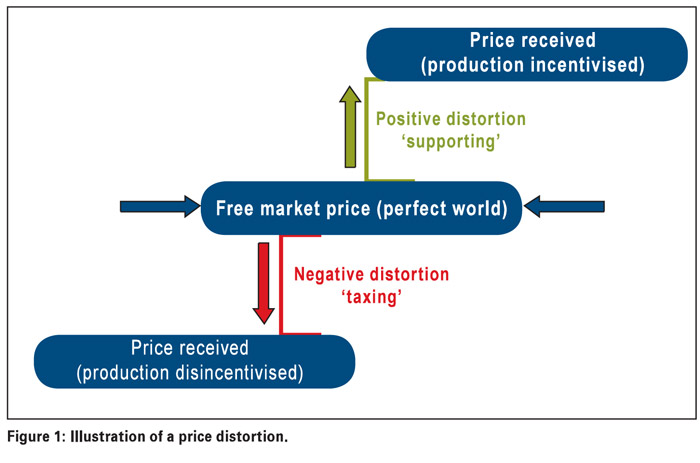
Positive distortions prevail where the price received by the specific value chain stakeholder is higher than the price that they would have otherwise received in a ‘perfect world’ free market. Consequently, such a situation is interpreted as the policy and operating environment ‘supporting’ the value chain stakeholder as their business operation is incentivised.
Where the price received is lower than the ‘perfect world’ price, negative distortions prevail and the situation is interpreted as the policy and operating environment ‘taxing’ or inhibiting the value chain stakeholder.
An empirical indicator known as the nominal rate of assistance (NRA) is used to quantify the magnitude of distortions. In broad terms, the nominal rate of assistance indicates the percentage by which gross incomes have been raised or lowered from the level that these incomes would otherwise have been at in an intervention free (undistorted) operating and policy environment.
These nominal rate of assistance distortion indicators are able to be calculated for individual agents in a vertical value chain such as producers, millers and consumers in order to quantify the degree to which each of these agents’ operating activities are ‘supported’ or ‘taxed’.
A positive nominal rate of assistance value for a specific agent indicates a positive distortion (‘supporting’ in Figure 1) whereas a negative nominal rate of assistance value indicates a negative distortion (‘taxing’ in Figure 1).
 Distortion values for the wheat value chain
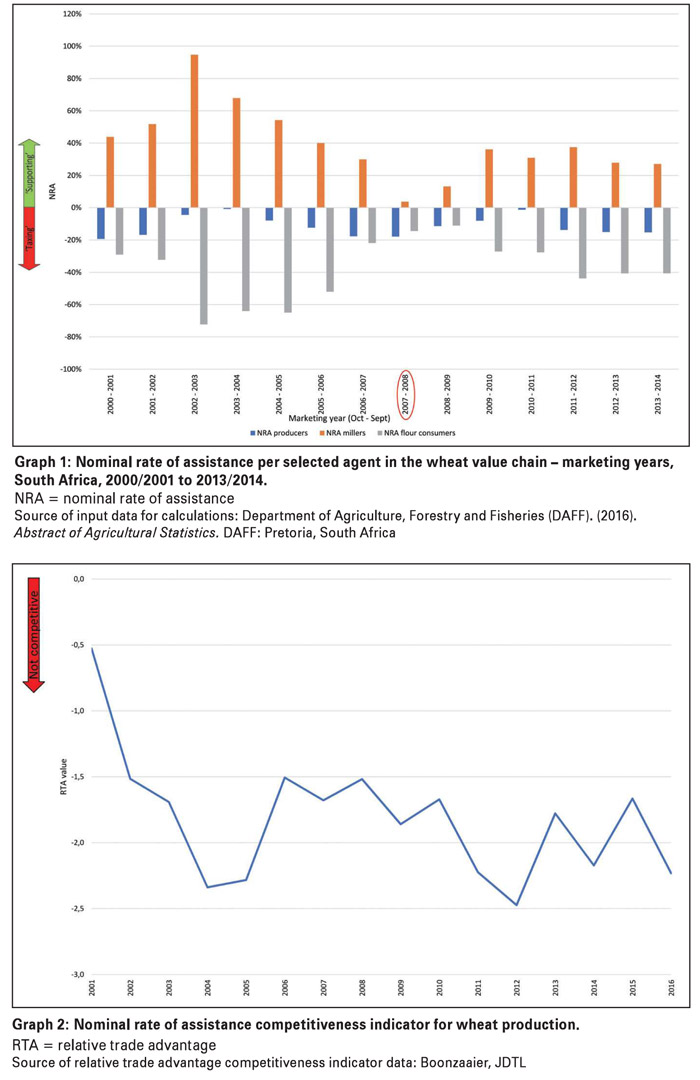
The distortion values for wheat producers, millers and flour consumers are depicted in Graph 1. Clearly evident from the nominal rate of assistance values is that over the time period analysed, wheat millers enjoyed the luxury of an operating and policy environment which provided tremendous support towards their business operation.
On the other hand, wheat producers and flour consumers were faced with an environment in which their existence and survival was disincentivised or ‘taxed’.
An interesting trend in the distortion indicators is the decline of the nominal rate of assistance to millers leading up to the 2007/2008 marketing year in which the wheat flour cartel was exposed.
Over a five-year period between 2002/2003 and 2007/2008, wheat millers went from receiving incomes 95% higher than they would otherwise receive in a perfect collusion free market to receiving incomes just 4% higher than would be received in a perfect market.
Thus, if the cartel bust marketing year of 2007/2008 is interpreted as a year with no collusion present in the wheat milling industry, the high positive nominal rate of assistance values prior to 2007/2008 can likely be attributed to the collusion at processing level which the cartel used to distort the incentives throughout the wheat value chain.
In simple terms, through collusion, the wheat milling industry was able to manipulate the operating environment and policy environment to the disfavour of all other value chain agents, but in favour of the wheat milling industry. This is re-iterated in the negative nominal rate of assistance in Graph 1 for wheat producers and wheat flour consumers who throughout the studied period found themselves being forced to operate in an operating and policy environment which disincentivised their existence and operation.
 Competitiveness and distortions
As alluded to in the introductory comments of this article, a value chain stakeholder’s competitiveness can be seen as a function of the operating and policy environment in which the specific stakeholder operates.
Empirically quantifying distortions enables us to measure the incentives or disincentives facing individual value chain agents and thus begin to answer the question regarding why some value chain stakeholders are deemed to be more competitive than others.
The relative trade advantage (RTA) is an indicator or proxy of competitiveness where positive relative trade advantage values reflect competitiveness and negative relative trade advantage values reflect non-competitiveness. (The relative trade advantage is a measure of overall industry competitiveness and should not be confused with farm level profitability. Thus, a negative relative trade advantage does not imply that every wheat farm in South Africa is operating at a loss.)
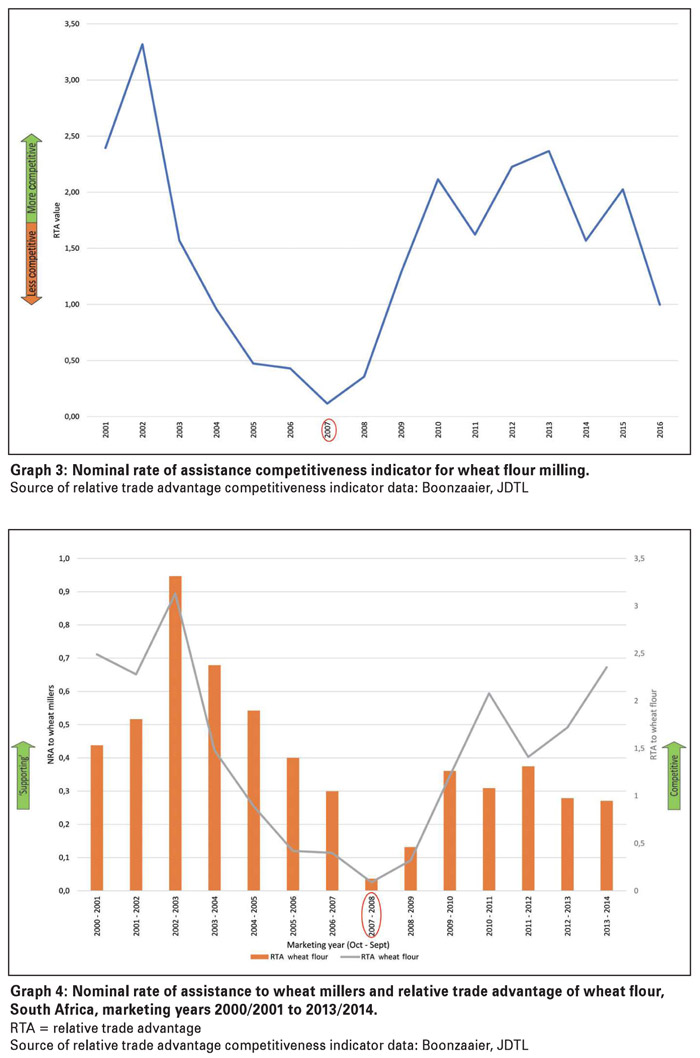
Graph 2 and Graph 3 illustrate the non-competitiveness of wheat producers and the competitiveness of wheat millers respectively.
If one focuses on the distortions facing wheat producers and millers in conjunction with their perceived competitiveness, we are able to progress past simply stating whether a specific value chain stakeholder is competitive or not and propose reasons why we observe certain competitiveness levels amongst value chain stakeholders.
For wheat producers, their non-competitiveness (Graph 2) was experienced while they operated in an environment disincentivising their existence (Graph 1). It is therefore no surprise that wheat producers were unable to increase their competitiveness under such a ‘taxing’ operating environment.
The link between wheat millers’ competitiveness and distortion indicators exhibit a concerning trend. When we compare wheat millers’ nominal rate of assistance indicators and relative trade advantage indicators it becomes evident that during years of perceived high competitiveness (high positive relative trade advantages), large positive distortions (nominal rate of assistances) were also present.
Both these large positive distortions as well as wheat millers’ competitiveness declined to near zero during the cartel bust year of 2007/2008. The distortion and competitiveness indicators are contained in Graph 4.
From the analysis of wheat millers’ competitiveness and distortions, it is plausible to propose that a possible reason why wheat millers were deemed to be competitive during the cartel years was because they were able to manipulate the entire wheat value chain’s operating and policy environment in their favour.
As the market power strength of the wheat flour cartel decreased leading up to 2007/2008, so did the ability of the wheat millers to distort the value chain incentives in their favour. This resulted in wheat millers being deemed to be less competitive because they were being forced to operate in a freer market without collusion.
The cartel bust year of 2007/2008 can possibly be considered as the closest that the wheat value chain has come to a perfectly free market due to the competition commission’s investigation of the industry. During this marketing period, wheat millers were operating in a marginally distorted market (such a small distortion can be deemed negligible) and their competitiveness was near zero, indicating marginal competitiveness.
This evidence re-enforces the prior suspicion that a large reason for wheat millers’ perceived competitiveness was because they were distorting the value chain operating environment in their favour.
Therefore, it is necessary to question the core competitiveness abilities, given specific proxies of wheat producers and millers were they to be operating in an undistorted environment (NRA = 0) free of collusion.
Implications: A worrying trend
The high nominal rate of assistance and high relative trade advantage values during the years leading up to 2007/2008 are able to be understood with the historic knowledge of the active wheat milling cartel which was able to manipulate the value chain operating environment in its favour.
However, Graph 4 depicts how these competitiveness and distortion indicators for wheat millers once again rose to similar levels as those seen during active cartel years even beyond the 2007/2008 marketing year.
This questions the transparency of the milling industry in its current state as well as the regulations governing the wheat milling industry post cartel bust. It furthermore necessitates analysis in order to determine why, in a supposedly free market, wheat millers are still able to distort the incentives in the value chain.
From Graph 1, it is clearly evident that the manipulation of the value chain’s policy and operating environment post cartel bust is once again to the detriment of wheat producers and wheat flour consumers and in favour of wheat millers.
From a producer’s perspective, it is extremely difficult to improve competitiveness in an unconducive operating environment where producers remain price takers. (The difficulty to integrate vertically in the value chain due to high barriers to entry with regards to operating capital and financing intensifies this challenging operating environment.)
This while consumers of wheat flour are forced to pay prices well above the would be free market equilibrium price and increase the inefficient share of value adding occurring at wheat processing level.
If the wheat sector sits back and accepts that wheat producers are not competitive and inefficient without probing why non-competitiveness is observed, the South African wheat value chain will grow in inefficiency as the big elephants of the wheat value chain continue to manipulate and self-regulate the incentives throughout the chain.
It is well overdue to question the core competitiveness of the key wheat value chain stakeholders and their perceived respective (in)efficiencies. Deeper analysis of the interaction of distortion indicators, competitiveness indicators and their link to anti-competitive behaviour is needed to determine whether it is indeed a case of the ‘inefficient producer’ as opposed to a more likely case of the ‘inefficient value chain’.
For more information contact Michael Day at michael@afrivalueconsulting.co.za.
Source
Source of relative trade advantage competitiveness indicator data: Boonzaaier, JDTL. 2017. South African wheat industry relative trade advantage data, e-mail to Day, MRB [Online], 28 August 2017.
Grain SA. 2017. Grain SA Market Report. Available: https://www.grainsa.co.za/pages/industry-reports/market-reports (accessed 05 May 2017).
SAGIS (South African Grain Information Service). 2017. South African Grain Information Service Information/Data. Available: http://www.sagis.org.za/index.html (accessed 04 August 2017).
Van Rooyen, CJ. 2008. The competitiveness of the South African agribusiness sector, 2008. University of Pretoria: Pretoria.

Publication: June 2018
Section: Relevant
