- Follow us:
- Our Commodities:
-
August 2017
The extreme drought conditions experienced during the 2015/2016 season, led to an almost 27% (184 500 ha) decline in soybean production area. Yield was also negatively impacted, with the average national yield decreasing from 1,56 t/ha in 2014/2015 to 1,47 t/ha.
The result was an almost 31% (328 000 tons) decline in the commercial soybean crop compared to the previous season.
Sunflower production surpassed soybean production for the first time since the 2010/2011 season. The major soybean-producing provinces, contributing 75% of the total crop, were Mpumalanga and the Free State. Figures were obtained from the Crop Estimates Committee.
According to the Bureau for Food and Agricultural Policy (BFAP) Baseline, Agricultural Outlook 2016 to 2025, a high demand for soybeans arising from expanded crushing capacity is expected to cause a sharp increase in area utilised for soybean production in 2017 (Graph 1). Assuming normal rainfall patterns, production is expected to recover to more than 900 000 tons this year.
An estimated 312,81 million metric tons of soybeans were produced during the 2015/2016 season, according to the World Agricultural Supply and Demand Estimates Report (WASDE – 563). The United States contributed 34%, Brazil 31% and Argentina 18% to this total. The world soybean production during the 2016/2017 season is projected to be 340,79 million metric tons. Soybeans account for more than half of the world’s oilseed production.
During the 2016 harvesting season, a representative sample of each delivery of soybeans at the various silos was taken according to the prescribed grading regulations. 143 composite soybean samples, representing the different production regions, were analysed for quality and the results were published in the fifth annual soybean crop quality survey report.
Quality results summarised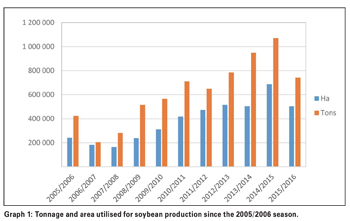
89% (127) of the 143 samples analysed for the purpose of this survey were graded as Grade SB1 and 16 of the samples were downgraded to class other soybeans (COSB). During the previous two seasons, 87% (2014/2015) and 88% (2013/2014) of the samples were graded SB1.
The majority of the samples was downgraded as a result of either the presence of poisonous seeds exceeding the maximum permissible number of either one per 1 000 g or seven per 1 000 g or as a result of the percentage other grain and/or foreign matter exceeding the maximum permissible deviations of 0,5% and 5% respectively.
According to the South African soybean grading regulations, the determination of the percentage wet pods in a consignment shall be done on a working sample of at least 10 kg of soybeans from a representative sample of the 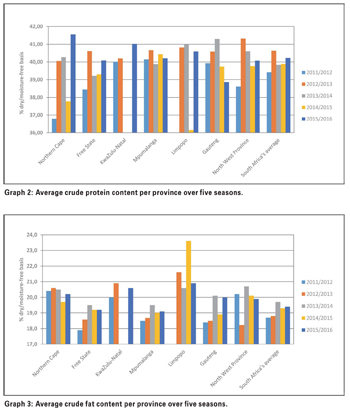 consignment.
Due to practical considerations, the samples received at the Southern African Grain Laboratory (SAGL) from the grain storage companies, are typically ± 5 kg. Pods were found in twelve of the 143 samples graded. All of these pods were green upon receipt at the SAGL, but not wet according to the definition. The percentage of these pods in the samples ranged from 0,05% to 0,50% based on a working sample size of at least 200 g.
The national average percentage foreign matter increased over the last five seasons to the highest level this season, increasing from 0,34% in 2011/2012 to 0,82% last season to 0,85%. The samples from the North West Province had the highest weighted average percentage, namely 1,62%. The percentage in the rest of the samples ranged from 0,26 in the Northern Cape to 0,91 in Mpumalanga.
The number of samples containing sclerotia increased from 20 in the previous season to 36 this season. The highest percentages of sclerotia observed (0,76% and 0,64%) were on samples from Mpumalanga, followed by a sample from North West Province with 0,60%. These percentages are, however, still well below the maximum permissible level of 4%. The national weighted average percentage this season was 0,04% compared to the 0,01% of the previous season.
North West Province (eight samples) reported the highest weighted average percentage soybeans and parts of soybeans above the 1,8 mm slotted sieve which pass through the 4,75 mm round hole sieve, namely 1,56% and the sample from the Northern Cape the lowest at 0,40%.
Mpumalanga with the highest number of samples (91) reported an average of 0,90%. The Free State averaged 1,03% (23 samples). The national weighted average percentage decreased from 1,81% the previous season to 0,92% this season.
The lowest weighted average percentage defective soybeans on the 4,75 mm sieve was observed on the samples from Mpumalanga, namely 1,46%. The Northern Cape reported the highest percentage of 4,94, followed by North West Province and KwaZulu-Natal with 3,99 and 3,34 respectively. The national weighted average increased slightly from 1,95% last season to 2,02% this season.
The South African weighted average percentage soiled soybeans of 2,06% is the highest since this survey was started in the 2011/2012 season when the average was 1,60%. The average last season was 0,77%.
Average weighted percentages per province ranged from 1,28 in the Northern Cape to 4,46 in Limpopo. Although the number of samples containing soiled soybeans as well as the average percentage soiled soybeans per sample increased significantly, none of the percentages were above the maximum permissible deviation of 10% according to the grading regulations. Last season, one sample from Mpumalanga exceeded this limit.
Test weight, providing a measure of the bulk density of grain and oilseeds, does not form part of the grading regulations for
soybeans in South Africa. An approximation of the test weight of these crop samples was done by determining the g/1 litre filling weight of each sample using the Kern 222 apparatus.
The test weight was then extrapolated by means of formulas obtained from the Test Weight Conversion Chart for Soybean of the Canadian Grain Commission. The weighted average this season was 70,9 kg/hl. Individual values ranged from 64,9 to 73 kg/hl.
Last seasons’ values ranged from 63,3 to 78,2 kg/hl and also averaged 70,9 kg/hl.
Soybeans are the most important oilseed crop produced in South Africa, driven mainly by the demand for protein feed in the animal feed industry. The nutritional component analyses, namely crude protein, - fat, - fibre and ash are reported on a dry/moisture-free basis (db).
The weighted average crude protein content this season was 40,22%, slightly higher than the 39,89% and 39,84% of the previous two seasons. The sample from the Northern Cape had the highest weighted average crude protein content of 41,56%, with Gauteng reported the lowest average, namely 38,86%. See Graph 2.
The weighted average crude fat percentage of 19,4% compared very well with the 19,3% in 2014/2015. The samples from KwaZulu-Natal had the highest weighted average crude fat content of 20,6%. The lowest average fat content was observed in Mpumalanga with 19,1%. See Graph 3.
The weighted average percentage crude fibre varied from 6,2% in Limpopo to 7,6% in the Northern Cape. The South African weighted average of 7,3%, was higher this season than in the previous season, when the average was 6,4%.
A small variation of only 0,05% is observed with regards to the national weighted average ash content over the five seasons that this survey has been conducted. This season, the average ash content was 4,61%. Samples from the Northern Cape and Limpopo tend to show higher ash contents over seasons.
The majority of soybeans produced/grown in South Africa is genetically modified and an estimated 95% of the area planted to soybeans in South Africa was GM. These soybeans have tolerance to herbicides (chemical products used to destroy weeds, but not the crop plants). Worldwide, GM soybeans occupy 80% of the area planted to soybeans.
15 (10%) of the crop samples were screened by means of the EnviroLogix QuickComb kit for bulk soybeans, to quantitatively determine the presence of the CP4 EPSPS trait (Roundup Ready®) and all the samples tested positive.
The results of this survey are available on the SAGL website (www.sagl.co.za). The hard copy reports are distributed to all the directly affected groups and interested parties. The report is also available for download in a PDF format from the website.

Publication: August 2017
Section: Focus on
