- Follow us:
- Our Commodities:
-
April 2022
| IKAGENG MALULEKE, AGRICULTURAL ECONOMIST AT GRAIN SA |
 |
The significant investment in the soybean sector is showing potential with increased hectares planted, yield increases and essentially production, coupled with good growing conditions, especially in the past season and potentially good prospects for the coming season.
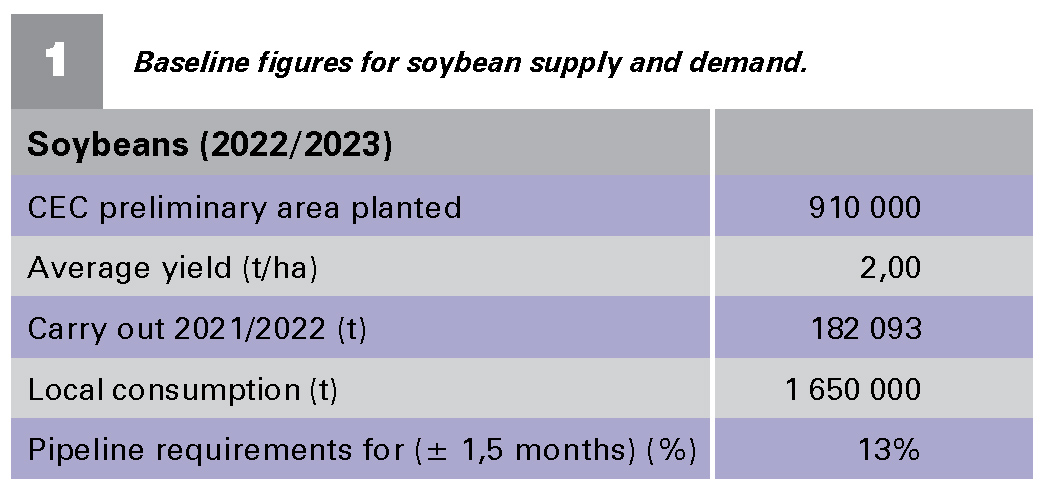
This article suggests different scenarios using the Crop Estimate’s Committee’s (CEC) preliminary area planted estimate for soybeans for 2022 and average yield as the baseline to determine the stocks to usage ratio (Table 1).
 STOCKS TO USAGE RATIO
Table 1 table shows the 2021/2022 consumption of 1,6 million tons of soybeans, which is about a 15% increase compared to the previous three-year average of 1,4 million tons.
Preliminary area planted has also increased by about 10,02% compared to the previous season, which is the highest area planted to soybeans in the history of South Africa. This comes as no surprise given the price incentive for soybean as well as the excessive increases in fertiliser and agrochemical costs in the market, which does not bode too well for maize production and rather favours oilseeds, given the lower input costs. Although, it is not advised that farmers plant oilseeds without applying fertiliser, especially if long term effects are considered.
LOCAL CONSUMPTION
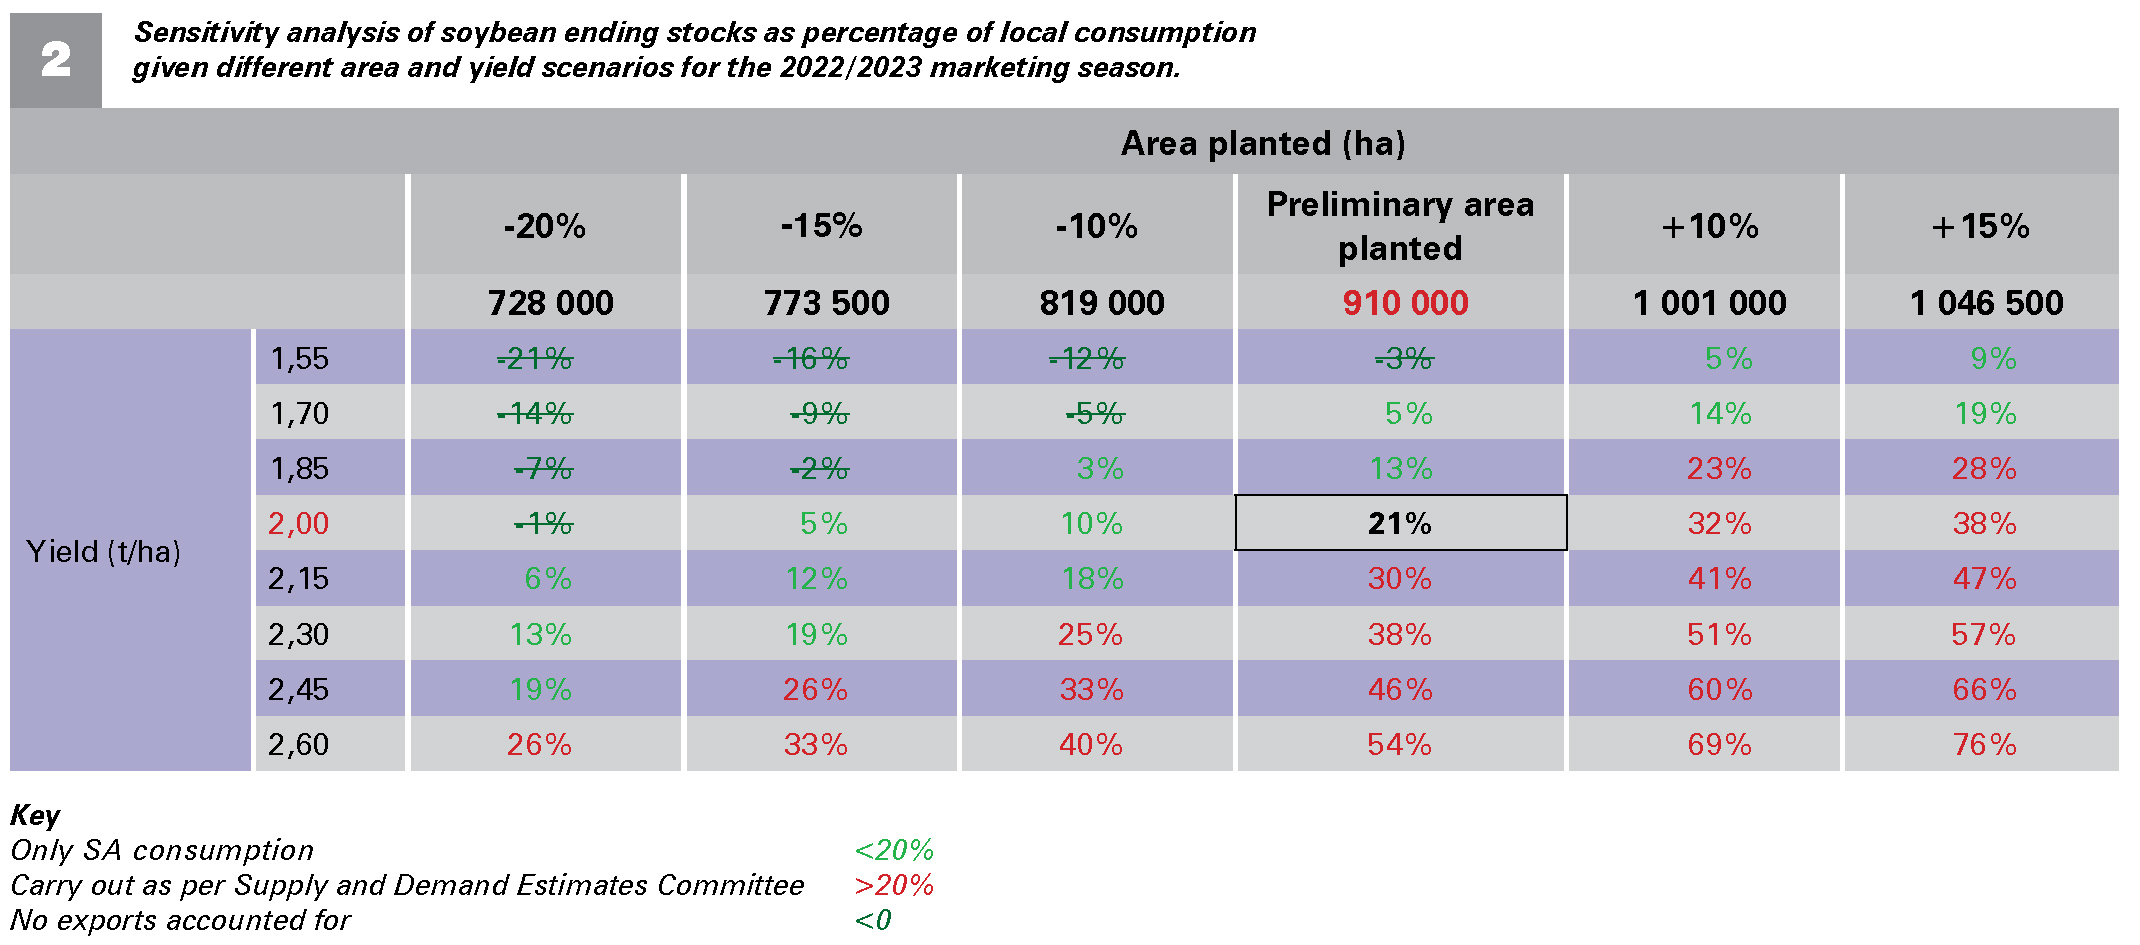
Table 2 indicates the sensitivity analysis of soybean ending stocks as percentage of local consumption given different area and yield scenarios for the 2022/23 marketing season. The CEC estimated soybean area of production at 910 000 ha (horizontal axis), with an average yield of 2 t/ha (vertical axis), which gives ending stocks as a percentage of local consumption at 21%.
When the sensitivity analyses indicate a stock to usage ratio of less than 13% it is low, above 13% is high and 13% is optimal. The stocks to usage ratio is a convenient measure of supply and demand interrelationships of commodities. The stocks to use ratio indicates the level of carryover stock for any given commodity as a percentage of the total demand or use.
Going towards the right of Table 2, if area planted deviates by +10%, or +15% above the preliminary area planted at the average yield of 2 t/ha, this would leave us with a stock to usage ratio of between 32% and 38%.
Going towards the left of the table, if area planted deviates by -10%, -15% or -20% less than the preliminary area at an average of 2 t/ha, the stocks to usage ratio will be less than optimal as it would be less than 13%.
Table 2 only accounts for local consumption and does not take any possible exports into consideration. If exports take place the stocks to usage ratio at the end of the 2022/2023 season could be totally different.
PRICES
Fundamentally supply and demand of a commodity – in this instance of soybeans – has a direct impact on prices. With a stocks to usage ratio of above 13% (high), prices will tend to be closer to export parity level (lower); this is due to higher ending stocks. With a stocks to usage ratio <13%, prices would tend to be closer to import parity level (higher); this is due to lower ending stocks.
With the current weather conditions, production is most likely going to be according to CEC preliminary planted area or just above the preliminary area, which could keep the prices closer to export parity.

Publication: April 2022
Section: Pula/Imvula
