- Follow us:
- Our Commodities:
-
November 2012
DIRK GÜNTER, MANAGER: AGRICULTURAL SERVICES, OVK
Variable rate irrigation, however, can only be applied efficiently if the irrigation deficit of the soil profile is known. Variable rate irrigation can be achieved with a combination of soil properties and with the measurement of soil water content.
The Terrascan field monitoring system is a low-power, lightweight and robust gamma-ray detector system intended for rapid in-situ mapping of soil parameters.
During recent years, the relation between natural radioactivity and various soil parameters has been quantified. Soil properties of value to agricultural applications, such as mineral composition, grain size, clay content and water-bearing capacity, are strongly tied to the presence of radioactive trace elements found in soils. The concentration of these elements (potassium, thorium and uranium) is specific for soil types and can be measured very accurately both in the field and on samples in the lab.
The system comprises a CsI-based scintillation detector mounted on a 1 024 channel multichannel analyser with built-in high voltage supply. The unit is mounted inside a rugged, watertight casing. Data and power to the system are transferred either via a powered Ethernet connection or via a RS232 serial link connection.
Scintillation detectors use crystals that emit light when gamma-rays interact with the atoms in the crystals. The intensity of the light produced is proportional to the energy deposited in the crystal by the gamma-ray. The mechanism is similar to that of a thermo-luminescent dosimeter. The detectors are joined to photomultipliers that convert the light into electrons and then amplify the electrical signal provided by those electrons.
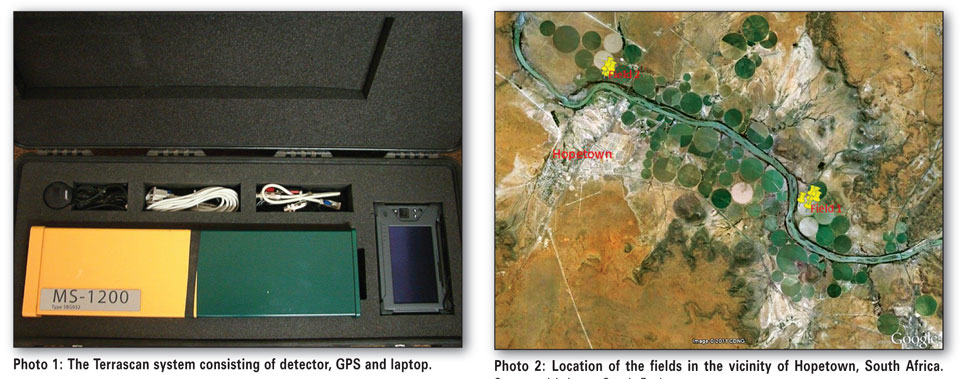
Depending on the client’s specification, the system is completed by a standard GPS, a differential GPS or a real time kinetic (RTK) GPS system. Readout is performed by a notebook or laptop PC equipped with a recent version of Microsoft Windows (Photo 1). Logging software is provided, integrating the readout of the detector system and the positioning/ height system.
For each acquired GPS position, a corresponding gamma spectrum is logged and a record is created containing GPS data (position, height, speed) and the count rates in the 40K, 238U, 232Th and (on request) 137Cs channels.
The system is designed for minimum operator interaction. It provides various views on the data streams while being acquired, allowing for online system checks. A map view plots the GPS navigation tracks as a breadcrumb trail. The colouring of the plotted trail depicts a (selectable) count rate, either reflecting variations in total count rate or one of the nuclide rates.
A radioactive atom core decays with a certain expectation, which is called half life time. The number of cores that decline each second for each kilogram matter is considered a unit called Becquerel per kilogram. The natural trace elements K40 (potassium), Th232 (thorium) and U238 (uranium) exist approximately 109 years.
There are a number of types of decay. The Terrascan measures the gamma-ray decay of the radioactive trace elements k40, th232, u238 and Cs.
Each soil type can be considered as a unique combination of radioactive trace elements; a fingerprint.
Fingerprinting and soil sampling
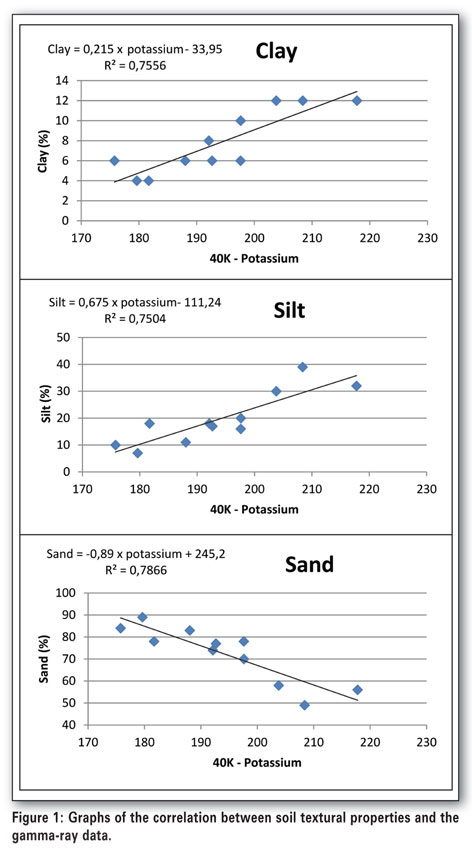
In agricultural applications, soil nutrient levels are influenced by management. There fore calibration for soil nutrient maps has to be based on general knowledge rules and samples of that specific field or farm. Physical soil properties and their natural gamma readings (Figure 1), however, can be compared regionally. The fingerprints of soil types and properties depend among others on parent material, soil forming processes and age.
Arial information
Area
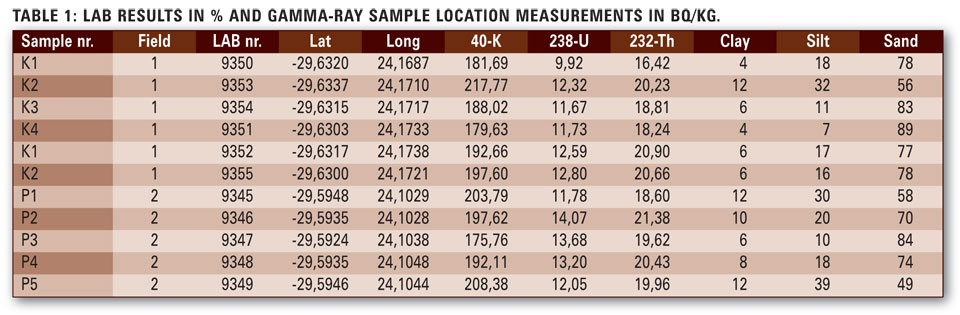
The fields (Photo 2) are situated near Hopetown, Northern Cape, South Africa. Both fields are irrigated and close to the river.
Strategy
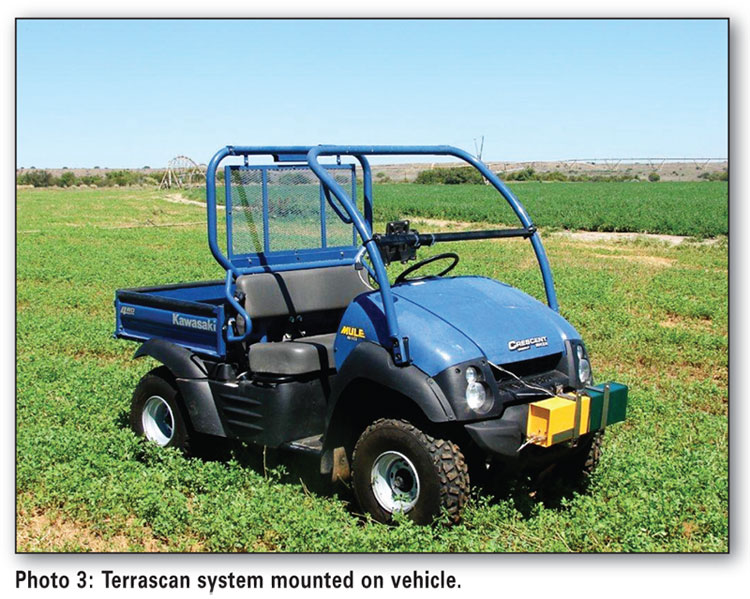
The fields are scanned with a gamma-ray spectrometer connected to a GPS and a tablet PC mounted on a small terrain vehicle. The data is then analysed using Gamman software. Based on the analysis results, the sampling locations are selected.
This selection is based on an optimal coverage of the (spread in the) measurement results and an optimal spatial coverage of the field. At the sampling locations a five minute measurement with the gammaray spectrometer is performed while taking a soil sample within a 3 m radius around the sensor and up to 40 cm - 50 cm in depth. This sample is mixed and analysed on soil properties at SGS laboratory and the data will be used in variable rate irrigation.
OVK specialised in the production of detailed spatial soil maps and uses traditional means as well as innovative scanning technology to analyse and map soil. These maps are used in determining the position of soil water content measurements and the variation in water-bearing capacity. The combination of these parameters leads to the segmentation of pivots for irrigation purposes (VRI).
The Terrascan is considered to be OVK’s most powerful sensor for top soil mapping.
Fieldwork
A 1,2 litre CsI gamma-ray spectrometer was mounted on a Kawasaki Mule vehicle (Photo 3). A Garmin GPS was used together with a twin head T8N tablet PC to log the data.
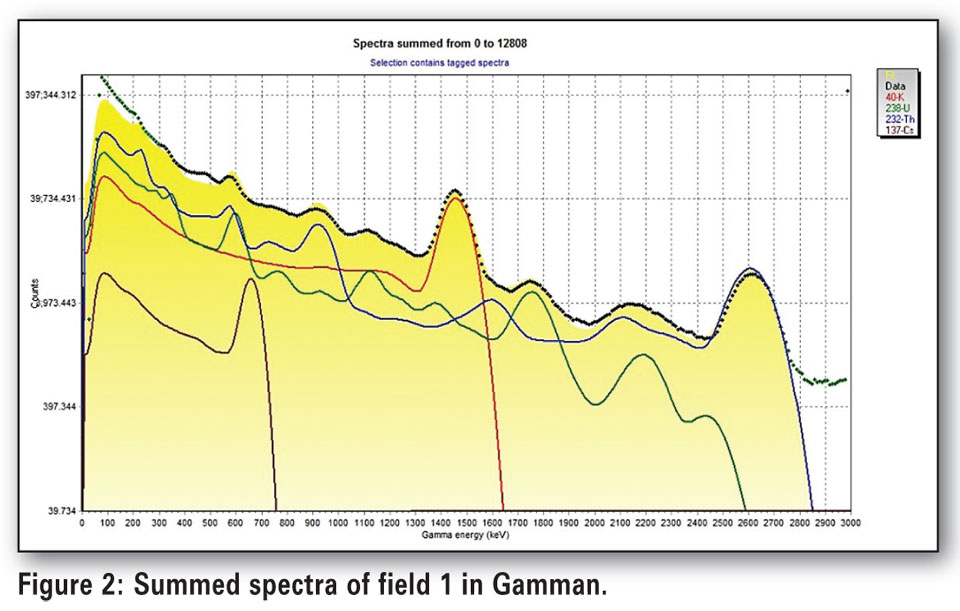
The field is a pivot of about 30 ha. The terrain is flat, measurement speed is about 15 km/h - 20 km/h and the field is scanned with a line spacing of about 15 m. Six samples were taken on this field after the measurement data was analysed using Gamman software. An impression of the spectra as analysed in Gamman is depicted in Figure 2.
Results
Data analysis
Spectral data
The data from the Terrascan was analysed using Gamman software. Thus yielding concentrations of the separate nuclides 40K, 232Th, 238U and an indication of total activity including the activity of 40K, 232Th, 238U, this total is called count rate. The data was separated by field and interpolated to field covering maps using SMS Software. The field boundary has been drawn on the maps based on the measurement points.
Spectral data to soil data
At the office the spectral data from the sampling locations has also been processed and analysed in Gamman. These five minute spectral measurements at the sampling locations are used to translate the spectral data to soil properties using the soil property analysis lab results of the soil samples.
This yields the correlations as depicted in maps (Figure 3 and Figure 4).
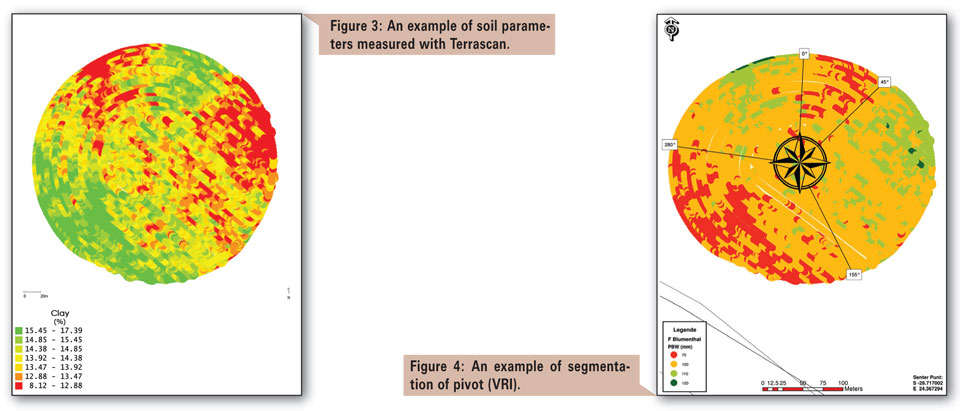
The correlations found in the data are used to calculate soil property maps from the interpolated gamma-ray maps. The interpolated gamma-ray maps and the textural soil property maps are shown in Figure 3 and Figure 4.
Resulting maps
The resulting maps show the distribution of clay and segmentation on a field.
Publication: November 2012
Section: Input Overview
