- Follow us:
- Our Commodities:
-
October 2017
Drought conditions experienced over large parts of the maize production regions during the 2014/2015 maize production season, together with the fact that the South African weather service indicated that the 2015/2016 season represented the lowest annual rainfall in South Africa since 1904, resulted in increased white and yellow maize imports compared to previous seasons, to support local demand.
The South African Grain Information Service (SAGIS) supply and demand figures show that white maize imports during May 2016 to February 2017 increased from 100 803 tons during 2015/2016 to 648 885 tons. The ten-year average for white maize imports is
29 180 tons. Yellow maize imports decreased over the corresponding period from 1 862 807 tons to 1 592 599 tons. The ten-year import average for yellow maize is 435 374 tons.
Maize imports during the 2015/2016 marketing season
240 samples of imported maize were received at the Southern African Grain Laboratory (SAGL) for quality analysis purposes and of these, eight samples were white maize. 22% of the 240 samples were downgraded to class other maize according to South African grading regulations. More than half of these were downgraded due to the presence of an undesirable odour and most of the remainder as a result of poisonous seeds in excess of the maximum permissible number, namely one per 1 000 g or seven per 1 000 g.
The results of the quality analyses performed on the imported maize are compared to those of the local maize crop of the corresponding class and grade and period (2014/2015). The 100 kernel mass of the imported maize was higher on average, as were the stress cracks.
The kernel sizes were more comparable than in previous seasons, but still smaller. The smaller kernel sizes of the local maize due to the drought conditions played a role. The average protein content of the imported maize was lower than that of the South African maize, while the average fat content was higher and the starch lower.
Multi-mycotoxin analyses were done on 75 composite samples per shipment. The Fumonisin, Deoxynivalenol (DON) and Zearalenone mycotoxin content was on average higher than locally produced maize. 20 yellow maize samples exceeded the national maximum Fumonisin (B1 + B2) level for raw maize intended for further processing and six samples exceeded Fumonisin B1 national maximum limits for animal feed.
Maize imports during the 2016/2017 marketing season
To date, 269 samples of imported maize were received at the SAGL for quality analyses purposes. The total number of samples include 86 white maize samples. 11% of the 269 samples were downgraded to class other maize according to South African grading regulations. More than half of these were downgraded due to the presence of an undesirable odour. The remainder was mostly downgraded as a result of total defective kernels exceeding the maximum permissible level of 30% or the presence of live insects in the samples.
The results of the quality analyses performed on the imported maize are compared to those of the 2015/2016 season local maize crop. The 100 kernel mass of the imported maize was lower on average (except for the white maize), the stress cracks were higher. The kernel sizes were more comparable than in previous seasons, but still smaller.
The smaller kernel sizes of the local maize due to the drought conditions again played a role, as in the previous season. The protein content of the imported maize was on average 1,1% lower than that of the South African maize, while the average fat and starch contents were higher.
Multi-mycotoxin analyses have been completed on 85 composite samples per shipment to date. Aflatoxin B1 and B2 residues were detected on a couple of samples (five white and one yellow), the B1 levels exceeded national maximum levels.
The Fumonisin, Deoxynivalenol and Zearalenone mycotoxin content was on average higher than locally produced maize. 27 yellow maize samples and two white maize samples exceeded the national maximum Fumonisin (B1 + B2) level for raw maize intended for further processing. Eleven yellow samples exceeded the national Fumonisin B1 maximum limits for animal feed.
Local production overview
The finalised crop figure for commercial maize for the 2015/2016 season as overseen by the National Crop Estimates Liaison Committee (CELC) is 7 778 500 tons. This is the lowest South African maize crop since the 2006/2007 season when 7 125 000 tons of maize were produced and presents a 22% reduction compared to the previous harvest.
White maize’s contribution to the total production was 3 408 500 tons (43,8%) and that of yellow maize 4 370 000 tons (56,2%). The major commercial maize-producing provinces are Mpumalanga, the Free State and North West Province, contributing
72% of the total maize production in South Africa.
The impact of the extreme drought conditions experienced over large parts of the maize production regions, is evident in the 26,6% decrease in total area utilised for maize production compared to the previous season.
The area decreased from 2 652 850 ha to 1 946 750 ha. White maize was planted on 1 014 750 ha and yellow maize on 932 000 ha (1 448 050 ha and 1 204 800 ha respectively in the 2014/2015 season).
The maize yield increased slightly from 3,75 t/ha in the previous season to 4 t/ha this season. White maize yielded 3,36 t/ha and yellow maize 4,69 t/ha, representing increases of 2,8% and 8,3% respectively compared to the previous season.
South African grading results
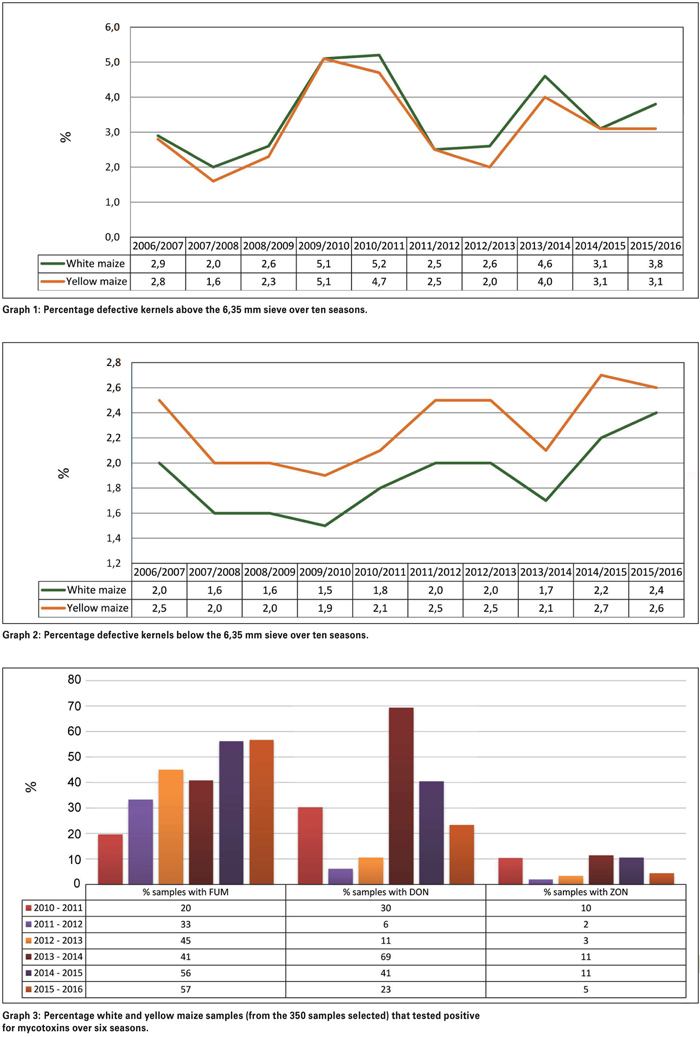
The maize crop was of good quality, with 72% of white and 78% yellow maize, graded as maize grade one, compared to 83% and 76% of the 2014/2015 season. The percentage total defective kernels above and below the 6,35 mm sieve, 6,2% for white and 5,7% for yellow maize, was respectively 0,9% higher and 0,2% lower than the previous season.
The percentage defective kernels for both white and yellow maize above the sieve, increased slightly (0,3%) compared to 2014/2015, the percentage defective kernels below the sieve stayed the same (2,5%).
Defective kernels include amongst others, mouldy, discoloured, insect damaged and small kernels that can pass through the 6,35 mm round hole sieve. The percentages Diplodia as well as Fusarium infected kernels were 0,1% lower and 0,3% higher than the previous season’s 0,7% and 0,9% respectively.
Foreign matter (0,2%) and other colour maize (0,3%) did not pose significant problems on the samples received, with only two white and yellow maize samples each, downgraded to class other due to foreign matter exceeding 0,75%. Foreign matter means all matter above the 6,25 mm sieve other than maize, glass, stones, coal, dung or metal.
No samples were downgraded as a result of the presence of other colour maize. The average percentage combined deviations of white maize were 6,7% compared to the 5,8% of the 2014/2015 season, that of yellow maize was slightly lower – 6% compared to 6,2%.
USA grading results
Of the 920 maize samples graded according to USA grading regulations, 58% were graded US1, 22% US2, 10% US3, 5% US4, 2% US5, while sample and mixed grades represented 2% and 1% respectively. The percentage samples graded as US1 varies substantially over seasons, namely 58%, 64%, 42% and 79% over the last four seasons. The percentage samples graded as US2 was similar to the 23% of the previous season.
The main reason for downgrading the samples was the percentage total damaged kernels exceeding the maximum limit per grade, followed by broken corn and foreign material. Per definition, damaged kernels are kernels and pieces of maize kernels that are badly ground-damaged, badly weather-damaged, diseased, frost-damaged, germ-damaged, heat-damaged, insect-bored, mould-damaged, sprout-damaged or otherwise materially damaged.
Physical quality characteristics
Bushel weight/test weight is applied as a grading factor in the USA grading regulations, but is also routinely done at most intake points locally.
White maize had an average test weight of 78,1 kg/hl compared to the 76,7 kg/hl of yellow maize. The test weight in total varied from 59,8 kg/hl to 83,9 kg/hl and averaged 77,3 kg/hl, equal to the previous season and the ten-year average.
Only 23 samples reported values below the minimum requirement (56 lbs or 72,1 kg/hl) for USA grade 1 maize, eight of these samples were from North West Province, seven from Mpumalanga, six from the Free State and one each from Gauteng and KwaZulu-Natal.
The 100 kernel mass averaged 32,1 g which is 2,3 g higher than the previous season and equal to the ten-year average. As in previous seasons, white maize (32,4 g) averaged higher than yellow maize (31,8 g). The kernel size of white maize was similar to the previous season while yellow maize kernels were larger than the previous season.
Kernel size is determined by sieving a 100 g whole maize sample through both 10 mm and 8 mm round-hole grading sieves. The percentage yellow maize kernels above the 10 mm sieve were on average 3,4% lower than white kernels and the percentage kernels below the 8 mm sieve 3,4% higher than that of white maize.
The kernel sizes observed this season, especially that of yellow maize, were slightly larger than the previous season, but still some of the smallest the past ten seasons.
Both white and yellow maize were less susceptible to breakage than during the previous season. The percentage stress cracks observed varied from 0% to 31%, averaged 5% and was a percent lower than in the previous season. White and yellow maize both averaged 5%.
Milling index values varied from 21,7 to 120,1 and averaged 95,5, 2,1 lower than the previous season. The average milling index for white maize is higher (99) than that of yellow maize (92,6). Milling index is an indication of the milling abilities and milling quality of maize kernels, where a higher milling index means a higher extraction of the high-grade and most profitable products like samp, maize rice and maize grits (de-germed products).
Roff milling and whiteness index
The average percentage extraction of total meal in white maize obtained with the 150 series roff mill, averaged 78,4% (0,3% lower than the previous season) and varied from 71,8% to 86,4%.
The whiteness index averaged 26,1 for unsifted and 17,5 for sifted maize meal. Sieving the sample through a 300 µm sieve and combining the fractions above and below the sieve in a 87:13 ratio, eliminate variations in the readings resulting from particle size differences.
The whiteness index of the previous season averaged 22,9 for unsifted maize meal. Sifted maize meal averaged 14,9.
The higher the whiteness index value obtained, the whiter the meal sample. The main contributing factors causing differences in whiteness index values are the presence of other colour maize like yellow maize, the presence of defective kernels, the type of cultivar as well as the soil composition.
The three samples with the lowest sifted whiteness index of values of -14,61, -9,30 and -7,41 this season, also had the highest percentages other colour maize ranging between 8% and 7,7%. The sample with the fourth lowest sifted whiteness index value had the highest percentage total defective kernels.
Nutritional component values
The fat, protein and starch nutritional component contents are measured with an Infratec 1241 – Generation 3 standard version whole grain analyser and reported as percentage (g/100 g) on a dry base. Foss updated the calibration on the Infratec 1241 Grain Analyser (NIT) during 2016, using NIT spectra and international primary chemical method results of maize crop quality samples from the 2012/2013 to 2014/2015 seasons, provided by SAGL.
The results obtained by the Infratec 1241 Grain Analyser on the 2015/2016 season’s samples, were checked by analysing every tenth sample by means of the primary methods.
In general, white maize tends to have a higher fat content than yellow maize, but a lower starch content (except for this season). The average fat content of the 2015/2016 crop samples was 4,1%, equal to the previous season and 0,2% higher than the weighted ten-year average. The fat content of white maize was 0,1% lower than the previous season, but 0,1% higher than the average of yellow maize (4%).
The average protein content of 9,7% was the highest since the 1995/1996 season and 0,3% higher than last season. The ten-year weighted average is 8,8%. The protein content of yellow maize equalled that of white maize at 9,7%. Yellow maize’s protein content increased with 0,2% and that of white maize by 0,3%, compared to the previous season. The ten-year weighted average of white and yellow maize is 8,8% and 8,9% respectively.
The starch content this season decreased on average by 0,4% compared to the previous season and is 0,3% lower than the ten-year weighted average of 72,7%. White maize equalled the previous season’s 72,6%. Yellow maize’s starch content was 0,6% lower than in 2014/2015.
Genetic modification (GM)
The SAGL screened 100 of the crop samples to test for the presence of the Cry1Ab, Cry2Ab and/or CP4 EPSPS GMO proteins/traits. SAGL used the EnviroLogix QuickComb kit for bulk grain to quantitatively determine the presence of genetically modified maize.
94% of the samples tested positive for Cry1Ab (Trade name/Brand YieldGard®), 78% of the samples tested positive for Cry2Ab (Trade name/Brand In GenuityTM, VT Triple PROTM and SmartStaxTM) and 99% of the samples tested positive for CP4 EPSPS (Trade name/Brand Roundup Ready®).
Mycotoxins
None of the 350 samples selected to represent white and yellow maize from the different production regions, tested positive for Aflatoxin, Ochratoxin A, HT-2 or T-2 toxin residues.
Fumonisin and Deoxynivalenol were found in samples from all the maize producing regions, except for Limpopo where no Deoxynivalenol was found the past two seasons. Different patterns of occurrence are observed in different seasons. Mean concentration levels also differ over seasons. Fumonisin tends to show higher mean concentrations on yellow maize compared to white maize from the same region. Zearalenone mean concentrations tend to show better correlation between white and yellow maize from the same region, than Fumonisin and Deoxynivalenol.
The average Fumonisin level (Sum of B1, B2 and B3) on all 350 samples tested, was 325 µg/kg (ppb) and ranged from 0 (not detected [ND]) to 11 347 µg/kg. This average is higher than the previous season’s 224 µg/kg. Of the 350 samples tested, 200 samples (57%) tested positive for Fumonisin levels and the average of these positive results was 569 µg/kg. The previous season, 56% of the samples tested positive, with an average of 397 µg/kg.
The highest Deoxynivalenol level detected was 1 585 µg/kg, compared to the 9 736 µg/kg of last season. The average level of all samples tested this season was 56 µg/kg, with 183 µg/kg the previous season. 41% of the samples tested positive for Deoxynivalenol last season compared to 21% this season. The average of the positive results decreased from 447 µg/kg in 2014/2015 to 259 µg/kg in 2015/2016.
2% of the samples tested positive for 15-acetyl-deoxynivalenol (15-ADON) residues. The average of the positive results was
163 µg/kg compared to 251 µg/kg in the previous season.
Zearalenone residues were found in 5% of the samples and values ranged from 0 (ND) to 127 µg/kg. The average of the positive samples was 49 µg/kg compared to the 60 µg/kg of the previous season when 11% of the samples tested positive.
Mycotoxin levels lower than the limit of quantitation (< LOQ) as well as limit of detection (< LOD) were seen as having tested negative for calculation purposes.
National mycotoxin regulations
According to the Foodstuffs, Cosmetics and Disinfectants Act (Act 54 of 1972) and regulations published under Government Notice No. R. 1145, dated 8 October 2004, all foodstuffs, ready for human consumption, may not contain more than 10 µg/kg of aflatoxin, of which aflatoxin B1 may not exceed 5 µg/kg.
Amendments to Government Notice No. R. 1145, dated 8 October 2004, published under Government Notice No. 987 of 05 September 2016, specify that:
The detailed results of local as well as imported maize are available on the SAGL website (www.sagl.co.za). The annual crop quality reports in PDF format are also available for download from the website.

Publication: October 2017
Section: Relevant
