- Follow us:
- Our Commodities:
-
August 2018
The 2016/2017 soybean crop quality survey is the sixth annual survey performed by the Southern African Grain Laboratory (SAGL). The goal of this survey is to compile a detailed database, by accumulating quality data collected from the national commercial soybean crop over several seasons.
This essential data set is a valuable tool, assisting industry with decision making processes. General tendencies are revealed and quality differences highlighted in the commercial soybean produced in different local production regions.
Quality analyses, which included grading, were performed on 150 composite samples. These composite samples, representing each delivery of soybeans at the various silos throughout the soybean production regions, were taken according to the prescribed grading regulations, during the 2017 harvesting season.
The majority of soybeans produced in South Africa is genetically modified (GM), with an estimated 95% of the area planted to soybeans in South Africa being GM. Worldwide, GM soybeans occupy 80% of the area planted to soybeans.
SAGL screened 15 of the crop samples to test for the presence of CP4 EPSPS (Roundup Ready®). The EnviroLogix QuickComb kit for bulk soybeans was used to quantitatively determine the presence of genetically modified soybeans. The kit is designed to extract and detect the presence of certain proteins at the levels typically expressed in genetically modified bulk soybeans. Results were scanned and interpreted quantitatively with the EnviroLogix QuickScan system. All the samples tested positive for the presence of CP4 EPSPS.
Grading was done in accordance with the regulations related to the grading, packing and marking of soybeans intended for sale in South Africa (No. R 370 of 21 April 2017). 85% (132) of the 150 samples were graded as Grade SB1, with 18 (15%) of the samples downgraded to class other soybeans (COSB). During the previous two seasons, 11% (2015/2016) and 13% (2014/2015) of the samples were downgraded to COSB.
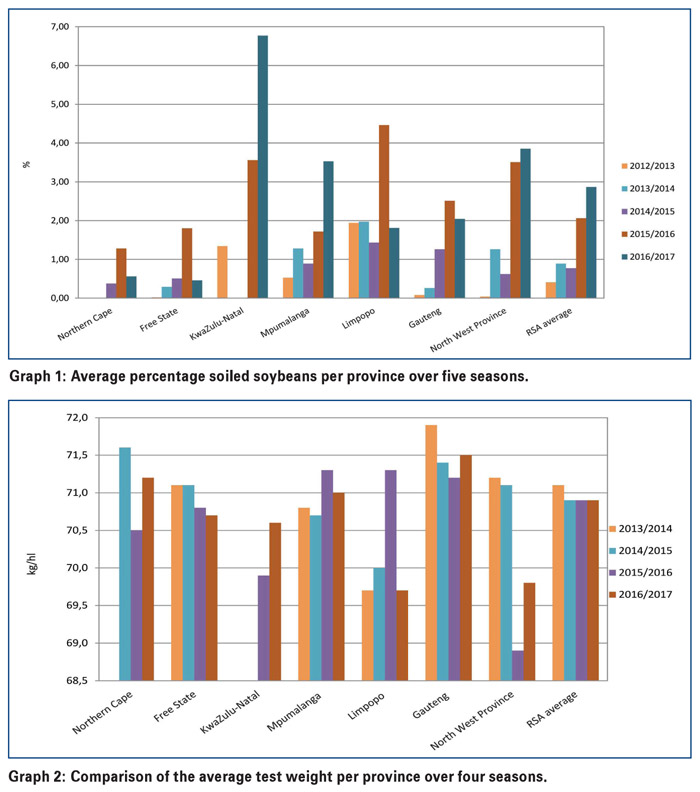 The majority of samples (61%) downgraded this season, was as a result of the percentage soiled soybeans present in the sample, exceeding the maximum permissible deviation of 10%. More than half of these samples originated from Mpumalanga. The South African weighted average percentage soiled soybeans of 2,87% is the highest since this survey was started in the 2011/2012 season, when the average was 1,60%. The average last season was 2,06%. See Graph 1 for the weighted average percentage soiled soybeans per province over five seasons.
Other deviations resulting in the downgrading of samples were the percentage other grain, the percentage sunflower seed present, the percentage foreign matter, as well as the presence of poisonous seeds. None of the samples graded contained any wet pods.
The national weighted average percentage soybeans and parts of soybeans above the 1,8 mm slotted sieve which pass through the 4,75 mm round hole sieve, decreased from 0,92% the previous season to 0,88% this season. This is the lowest percentage of the six seasons for which crop quality data is available. The national weighted average percentage defective soybeans on the 4,75 mm sieve increased slightly from 2,02% last season to 2,22% this season.
The percentage of samples containing sclerotia from the fungus Sclerotinia sclerotiorum, almost tripled from the previous season (from 25% to 70%). The three highest percentages of sclerotia observed (0,38%, 0,36% and 0,30%) were on samples from Mpumalanga.
These percentages are, however, still well below the maximum permissible level of 4%. The national weighted average percentage this season was 0,07% compared to the 0,04% of the previous season.
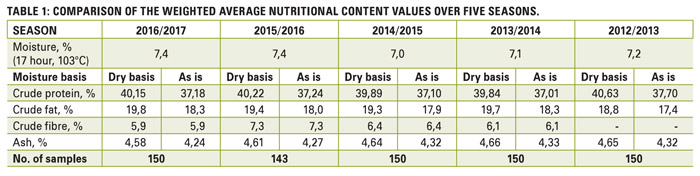
Although test weight does not form part of the grading regulations for soybeans in South Africa, the g/litre filling weight of each soybean sample was determined by means of the Kern 222 apparatus. The test weight values were then extrapolated by means of formulae obtained from the test weight conversion chart for soybean of the Canadian Grain Commission. See Graph 2 for a comparison of the test weight per province over the past four seasons. These approximated values provide a measure of the bulk density of South African soybeans.
For a summary of the nutritional content analyses, namely crude protein, - fat, - fibre and ash obtained over a period of five seasons, see Table 1. These results are routinely reported on a dry/moisture-free basis (db), for comparison purposes however the national ‘as is’ basis results are provided as well. These ‘as is’ values were calculated using the weighted national average moisture values.
Visit our website (www.sagl.co.za) for detailed results of this, as well as previous surveys. The reports are also available for download in a PDF format.

Publication: August 2018
Section: Mini-Focus on Soybeans
