- Follow us:
- Our Commodities:
-
March 2017
South Africa is a net importer of wheat and relies on imports to supply the growing local demand. The quality of all wheat imported into South Africa is monitored by the Southern African Grain Laboratory (SAGL).
A subsample of all samples drawn during the previous season by inspectors of the South African Agricultural Food, Quarantine and Inspection Services (SAAFQIS) of the Department of Agriculture, Forestry and Fisheries (DAFF) was forwarded to the SAGL for analysis. The country of origin of the samples were confirmed with information received from the South African Grain Information Service (SAGIS).
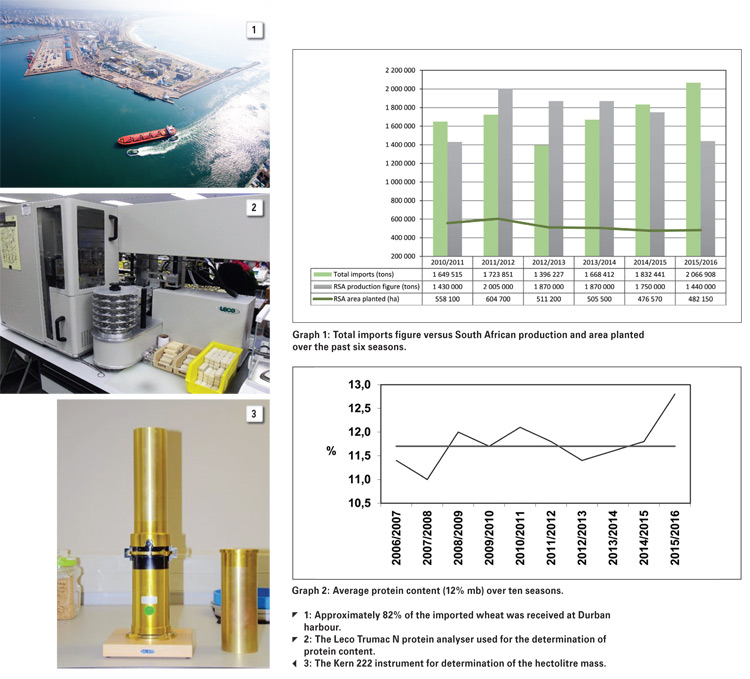
In total 200 samples were received from nine countries of import. These samples consisted of nine samples from Argentina, eleven samples from Australia, 14 samples from Canada, 25 samples from Germany, 17 samples from Lithuania, 20 samples from Poland, 69 samples from the Russian Federation, five samples from the Ukraine and 30 samples from the USA. Approximately 82% of the imported wheat was received at Durban harbour.
Most of the wheat imported to South Africa is blended with local wheat to obtain a certain milling and baking quality as per individual company specifications. Milling companies will blend higher and lower quality wheat to obtain the most cost effective grist formulation that conforms to a specific quality. The main objective is to supply the most constant quality of flour to their customers (bakers) as possible, as in the end, consistency is one of the most important quality parameters.
Towards the end of the production season, it may however become necessary for milling companies to mill wheat blends consisting only of imported wheat. Transportation cost is also an important fact for consideration. The grist formulation of mills situated at the coast will as a result consist mainly of imported wheat whereas inland mills will mill a combination of local and imported wheat.
To assist with quality comparisons between local and imported wheat, the same scope of analysis is used for both sets of samples. Only twelve of the 200 samples had hectolitre mass values below the minimum level (77 kg/hl) for grade B1 wheat and only three samples were below the minimum falling number value (220 seconds). Seven samples had whole wheat protein levels below the minimum level (10%) for grade B3 wheat.
Except for wheat imported from Australia and Canada, the imported wheat samples tended to have lower Farinograph water absorp tions and shorter development times than local wheat. The Alveograph distensibility values also tended to be shorter, while the Mixograms showed a tendency towards longer peak times. Wheat imported for purposes other than bread baking (e.g. soft types for biscuit making) is included in this data set.
A total number of 67 composite samples per shipment, per country of origin were analysed for Aflatoxin G1, B1, G2, B2, Fumonisin B1, B2, B3, Deoxynivalenol, 15-ADON, Ochratoxin A, Zearalenone, HT2- and T2-toxin levels.
The mycotoxin residue levels detected on the composite samples did not raise any major concerns. Most samples tested negative for all of the mycotoxins mentioned above. On the samples that did test positive for some of the mycotoxins, Deoxynivalenol was the most prevalent.
One sample from the USAs Deoxynivalenol level (1 813 μg/kg) was higher than general internationally acceptable values, but lower than the national maximum allowable level of 2 000 μg/kg for cereals intended for further processing. This sample also tested higher (215 μg/kg) than the maximum European Union (EU) level of 100 μg/kg for Zearalenone. The highest average mycotoxin levels were found on samples from the USA.
South African wheat
The national whole wheat protein average of 12,8% is the highest since the 2004/2005 season and can be attributed to the drought conditions experienced this season. Protein content is generally a function of the environment (soil and climatic conditions), where the wheat was grown as well as fertiliser treatment, whereas protein quality is genetically controlled and depends mostly on the wheat variety.
The percentages of samples having protein contents exceeding 13%, increased significantly from 16,4% and 18,3% in the previous two seasons to 43,2% this season. Contrary to expectations based on previous experience, the winter rainfall areas did not have the lowest whole wheat protein average (12,8%) this season.
This position was taken by the irrigation areas, with an average of 12,6%. The production regions in the Free State Province, reported the highest average protein content (13,2%) as in previous seasons.
Grade B1 wheat in the Free State Province amounted to 52% (48% in the previous season). In the irrigation areas 60% (46% inthe previous season) of the wheat graded as B1 and in the Western Cape Province 37% graded as B1 (8% in the previous season). The increase in the number of samples graded B1 this season, can be attributed to the increase in protein levels observed over all of the wheat production areas, especially the Western Cape.
Determination of the protein content is done by means of the Dumas combustion analysis technique. The sample is combusted at high temperature (1 100°C) in pure oxygen which sets nitrogen free, which is then measured by thermal conductivity detection.
The total nitrogen content of the sample as determined, is converted to equivalent crude protein by multiplication with a factor of 5,7 to obtain the protein content. This factor is based on the amino acid composition of the proteins in wheat as well as the varying levels of non-protein nitrogen present in wheat.
Drought conditions, as already mentioned, can result in an increase of the protein content of a wheat kernel, which is advantageous to the producer selling the wheat. A combination of water stress and high temperatures during specific grain filling stages of the wheat plant, can however influence plant metabolic processes and wheat quality to varying extents, leading to changes in the protein composition and size distribution of starch granules which will in turn affect baking quality.
Hectolitre mass or test weight, the mass of a standard volume of grain, is generally believed to be a measure of the grain’s bulk density and an indication of the potential flour yield of wheat.
The latter is not always true since hectolitre mass is also correlated with factors such as the density and packing characteristics of the wheat kernel. Hectolitre mass is influenced by amongst others, cultivar (skin appearance – smooth or wrinkly), moisture content and the presence of other grain, unthreshed ears, foreign matter, broken grain and screenings.
The average hectolitre mass increased by 0,9 kg/hl to 81,1 kg/hl compared to the previous season and was also higher than the six year weighted average of 80,5 kg/hl for determinations done by means of the Kern 222 instrument.
Of the 21 samples that reported values below the 77 kg/hl minimum level for grade B1 wheat, twelve originated in the Western Cape (winter rainfall area), five in the North West Province, three in the Free State and only one in Limpopo. The regional averages ranged from 79,7 kg/hl in the winter rainfall areas to 82,6 kg/hl in the irrigation areas.
The thousand kernel mass, reported on a 13% moisture basis, decreased further from 39,3 g in the 2013/2014 season to 38,8 g in the past season to 36,8 g this season. Averages over production areas varied from 34,8 g in the Free State to 37,9 g in the irrigation areas. The weighted average percentage screenings (1,8 mm sieve) of 1,71% was higher than the 1,55% and 1,58% of the previous two seasons. The winter rainfall areas reported the highest average percentage, namely 1,86% and the irrigation areas the lowest of 1,43%.
The weighted average falling number was 393 seconds, the highest average value of the past 18 seasons. As a result, none of the samples analysed for this survey reported falling number values below 250 seconds. The highest average falling number value of 405 seconds, was reported for the irrigation areas.
All falling number values reported are corrected for the altitude at which the test is performed. During the previous two seasons four and 29 samples respectively reported falling numbers below 250 seconds.
The weighted mixogram peak time on flour from the Quadromat mill averaged 2,7 minutes, shorter than the 3 minutes of the previous two seasons as well as the ten year average (2,9 minutes).
Extraction rate is an indication of the flour yield that can be obtained from a given amount of wheat. The extraction rate achievable on industrial scale mills is a number of percentage points higher than on laboratory scale mills due to an increase in roller surface area.
Composite samples per class and grade per production region are cleaned, tempered/conditioned and then milled to facilitate flour and dough quality assessment.
The weighted average Bühler MLU 202 laboratory mill extraction for the 70 composite samples was 73,4%, equal to the previous season.
The average Kent Jones colour this season was -3,5 KJ units, slightly lower (in other words lighter/brighter) than the previous season.
The CIE L*a*b* values, determined by means of the Konica Minolta CM-5 spectrophotometer, compared to the range of average values obtained from the 2012/2012 to 2014/2015 seasons (indicated in brackets), showed good correlation – L* 93,78 (93,77 - 93,99), a* 0,47 (0,40 - 0,44) and b* 9,75 (9,50 - 9,392) L* represents lightness (100 being white and 0 being black), a* represents green to red variation and b* represents variation from blue to yellow.
The average ash content was determined to be 0,65% on a dry basis (moisture free basis), compared to the 0,59% of the previous season. According to the wheat product regulations (Government Notice No. R. 186 of 22 February 2008), cake flour’s ash content should not exceed 0,60% and white bread flour’s should be between 0,6% to 1%.
The wet gluten (14% mb) averaged 31,9% and the dry gluten also on a 14% moisture basis, 11%. These values are higher than the 28,9% and 9,8% respectively of the previous season, as can be expected taking the higher protein contents into account. The average gluten index value was 95, ranging between 84 and 99.
The gluten index provides an indication of the gluten strength (higher being better) and is not influenced by the protein content. A value between 70 and 100 is generally accepted as good quality for pan bread baking purposes. The average gluten index value last season was 88.
The weighted mixogram peak time of the flour from the Bühler mill was 2,6 minutes, comparing well with the 2,7 minutes last season. Mixing time, in general, decreases as protein content increases to about 12%, thereafter remaining approximately constant with flour protein increases.
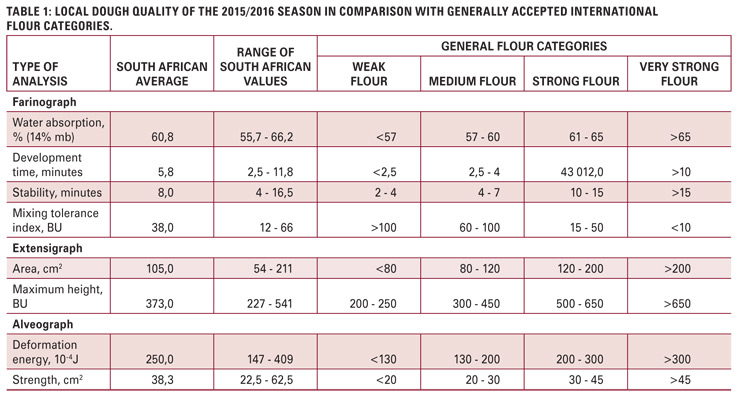
In general, a medium to strong flour quality is required for the type of baking processes used in South Africa for pan baked loaves, see Table 1.
The 100 g loaves baked using the straight-dough optimised bread making method, received an evaluation rated as ‘Excellent’. The basis for this evaluation refers to the relationship between the protein content and the bread volume.
40 samples, randomly selected to represent different regions as well as classes and grades, were tested by means of a SANAS ISO/IEC 17025 accredited multi-mycotoxin screening method using UPLC-MS/MS. With this technique simultaneous quantification and confirmation of Aflatoxin G1; B1; G2; B2, Fumonisin B1; B2; B3, Deoxynivalenol, 15-ADON, HT-2 Toxin, T-2 Toxin, Zearalenone and Ochratoxin A are possible in one run.
Four samples tested positive for Deoxynivalenol (DON) residues. The average value of the four positive results were 397 μg/kg (ppb) and the highest value measured 593 μg/kg, which is still well below local and international maximum residue levels. Last season, five samples tested positive for DON residues with an average value of 229 μg/kg (ppb) and the highest value obtained 361 μg/kg.
The 2015/2016 local and imported wheat quality results are available on the SAGL website, the latest wheat crop quality report can also be downloaded in PDF format.
Our sincere appreciation to the Winter Cereal Trust for financial support of this annual survey, to Agbiz Grain members and milling companies for providing the crop samples as well as DAFF inspectors at the harbours for providing representative samples of each shipment of imported wheat.
Publication: March 2017
Section: Relevant
