- Follow us:
- Our Commodities:
-
November 2012
DIVAN VAN DER WESTHUIZEN, PROJECT MANAGER: FARM LEVEL ANALYSIS, BUREAU FOR FOOD AND AGRICULTURAL POLICY
Will the global agricultural system be able to respond to the increasing demand for raw material in the intermediate term? This question was one of the key topics of this year’s international agri benchmark Cash Crop Conference that was held in South Africa this year.
From 9 to 15 June, the network of leading international farm production economists held its annual meeting in Pilanesberg. Invited by the South African partner organisations, the Bureau for Food and Agricultural Policy (BFAP) and the National Agricultural Marketing Council (NAMC), 38 delegates from 23 different countries came together to discuss recent developments and perspectives in global crop production.
Significant potential to boost global crop production
Selected case studies from Argentina, Poland, the Ukraine, Morocco, USA, Australia and Bulgaria indicated that technically and economically speaking, there is a huge potential to boost output on current available land. For example, Pawel Boczar (University Poznan, Poland), illustrated that the average Polish dryland wheat yields are in the range of 4 tons per hectare, while well-managed farms are able to harvest between 6 tons to 7 tons per hectare. In some cases, yield levels on well-managed farms exceeded 9 tons per hectare. The key requirements for increased yields are improvements in plant nutrition, seed quality and plant protection.
Furthermore, the example of Argentina indicates that the challenges for an expansion in land use are not dominant. Marginal investments in development are needed in order to expand arable production significantly. The agri benchmark partner, Martin Otero (Hillock), made clear that even under strict regulations, until 2020, an expansion of arable land by 20% to 40% is a plausible scenario. Consequently, provided there were stable grain markets for Argentine farmers, an increase in oilseed production by up to 25% and in grain production by 75% would be realistic.
Recently, high commodity prices and significant improvements in profitability of crop production, generated a strong incentive to expand production. This may change the agricultural commodity market from a seller’s to a buyer’s market yet again. Scenario calculations for agri benchmark farms around the globe, indicate that the long-term historical average floor price for wheat might be 30% or 50 dollar per ton less than what is being realised nowadays. Yelto Zimmer (Thünen Institute, Germany) therefore concluded that a lasting period of considerable lower commodity prices is possible.
Global forum
The conference was concluded on 15 June in Pretoria, with a global forum event for which roughly 80 local representatives from the agricultural industry were invited to attend. One of the key topics was a comparison between the United States’ and the South African maize production, analysed by BFAP and Kelvin Leibold (Iowa State University, USA).
The objective of the analysis was to illustrate how South African maize producers compare to the United States (US), which in addition provides an indication of the relative competitiveness between the respective countries.
The US analysed farm is situated in the Iowa region and consists of 688 hectares of dryland, arable land. Maize and soybeans are annually produced on a 50:50 ratio production system and captures a conventional tillage with reduced stubble breaking and mulch seed approach.
The annual precipitation is 888 millimetres and the general strategy of the farm business is to increase marketing skills and capture more of the value of the bio-fuels industry. Graph 1 illustrates the respective yields of the typical farms in South Africa (dryland and irrigation) and the Iowa representative farm (dryland).
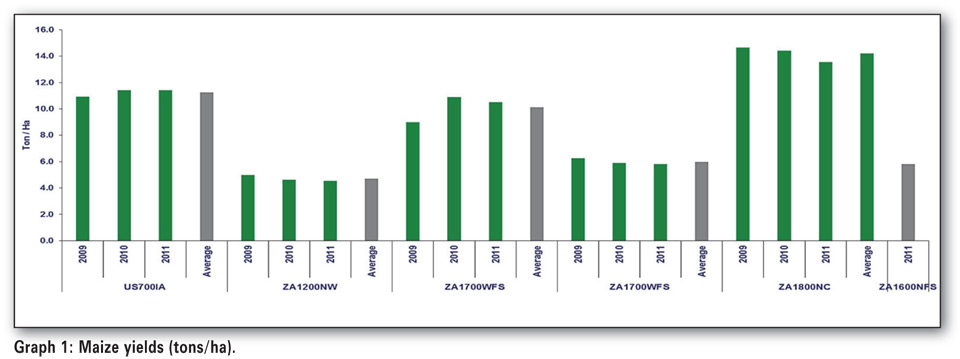
It should be noted that the numbers in the text on the x-axis refers to the respective sizes of the farms and the letters, to the specific regions. The graph clearly indicates that when dryland yields are compared, the US Iowa region outperforms South African dryland farms. The latter is due to the high organic content available in the loamy (silt and clay) type of soils and a substantially high dryland plant population (80 000 per hectare) which is similar to the Northern Cape irrigation region. In addition, a definite advantage exists due to the soybean/maize rotational effect and technology farm practises. The three year average yield in Iowa was 11,25 tons per hectare.
The important question to be asked is how representative farms in South Africa compete against global leaders. Therefore, answering the question of who can produce one ton of maize the cheapest, remains an important driver in global competitiveness. Graph 2 illustrates selective direct allocated costs for maize production on a per ton basis. Thus, what does it cost to produce one ton of maize?
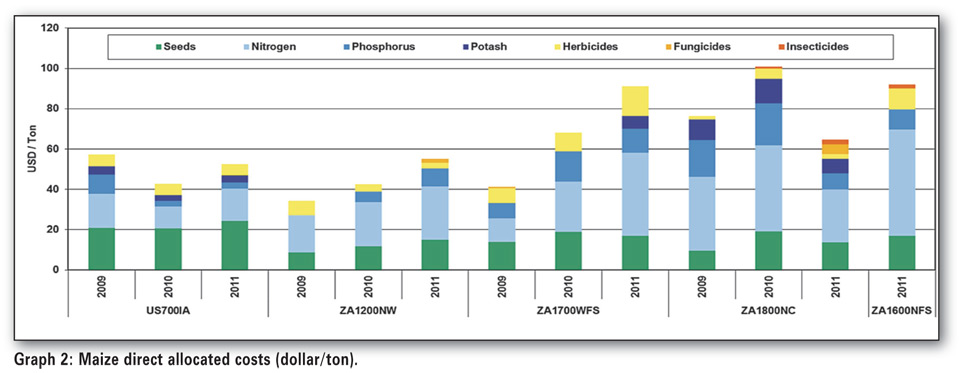
It can be observed from Graph 2 that the cost of seed is more expensive in the US than in South Africa, mainly due to technology costs (research and development) that farm businesses have to incur. The average cost of seed on the Iowa farm is approximately 247 dollar per ton. The three year average dryland seed cost in the western Free State and North West Province were 99,23 dollar and 55,39 dollar per ton respectively.
Graph 2 further illustrates that the cost of fertiliser, especially nitrogen, is substantially higher in South Africa than in the US. The cost of transportation, both deep sea freight and domestic transportation costs, are the key driver for higher fertiliser cost in South Africa. A depreciating rand/dollar exchange rate further impacts the price of selective fertilisers domestically.
A profitability comparison is illustrated in Graph 3. The red diamonds represents the gross revenue per ton and the green spots, the revenue including decoupled payments (subsidies). The margin between the red diamonds and the cash cost including depreciation, indicates the profitability on a per ton basis.
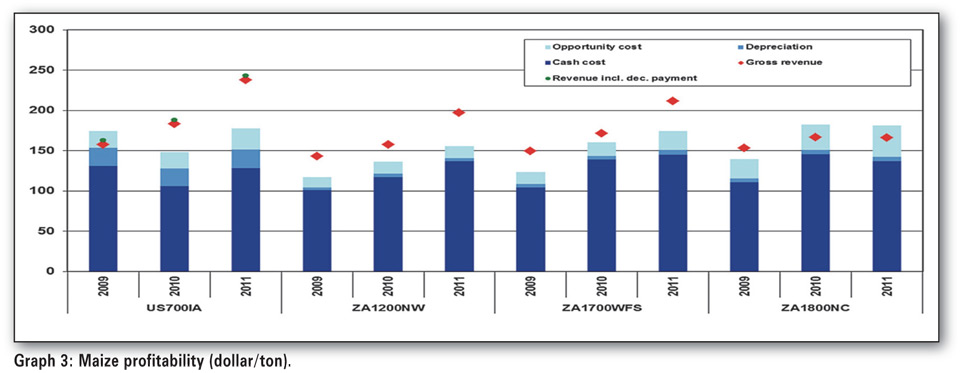
In general, the South African dryland farms indicated positive margins and reflected well when compared to the Iowa farm business. What is important to note from the Graph is that:
Continuous input inflation should be considered as an early warning indicator and that farm businesses should carefully manage agricultural inputs, especially in an environment where commodity prices are extremely volatile.
Conclusions
The general conclusion is that South African farm businesses are relatively competitive when compared to the case study or an Iowa typical farm. However, major disadvantages that impact South African farms are the cost of fertiliser and key production limitations such as soil types, content and rainfall. The general consensus is that US agricultural subsidies will continue to decline in the future. Finally, from a US perspective it is argued that yield levels will continue to increase due to new hybrids and genetics.
Publication: November 2012
Section: Other Articles
