- Follow us:
- Our Commodities:
-
June 2015
WANDILE SIHLOBO, economist, Industry Services, Grain SA and TINASHE KAPUYA, manager: Trade and Investment, Agbiz
Identifying strategic export markets for SA sorghum industry
This year, South Africa is confronted by drought and the country is expected to be a net importer of grains. Nonetheless, that does not cease the need to grow export markets for the South African grain industry, especially since the industry faces the challenge of high export concentrations in traditional markets.
The need to grow export markets was widely echoed in several sorghum specialists’ working group sessions. Hence, this article will focus on identifying the strategic export markets for the South African sorghum industry. The analysis will be done using grain sorghum trade data, HS code 1007. We start by discussing the trends in South Africa’s sorghum exports, Harmonised System (HS) product classification for South Africa’s sorghum exports, explore leading world importers and lastly suggest the strategic export markets.
 South African sorghum export trends
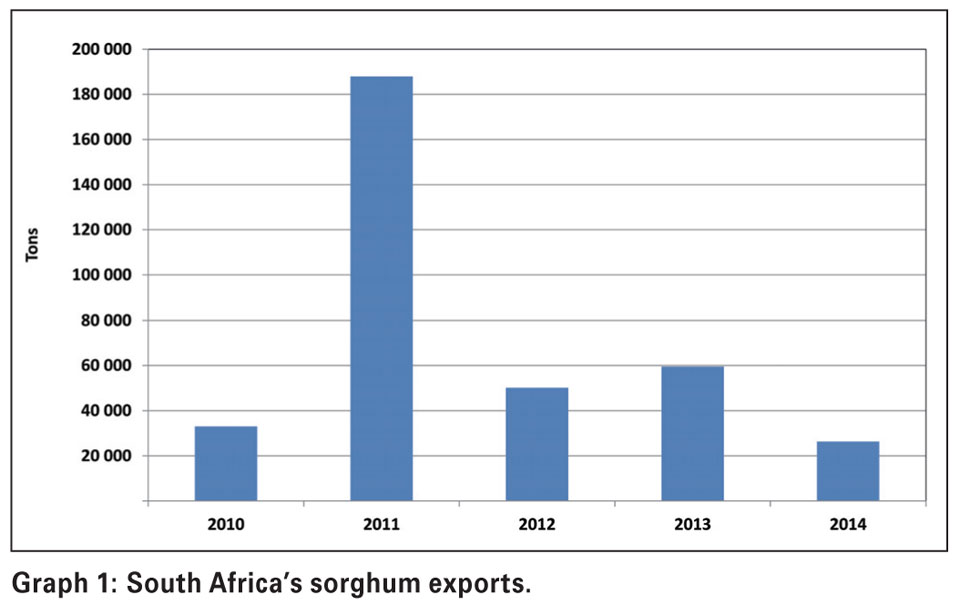
South Africa’s sorghum exports are generally irregular and inconsistent (see Graph 1). This lack of consistency can primarily be attributed to uneven surplus levels and increasing production in traditional export markets.
Approximately 99% of sorghum is exported by South Africa to the Southern African Development Community (see Table 1). Botswana and Swaziland account for 98% of the South African sorghum exports’ share. The other key export markets within the continent are Kenya, Uganda and Sudan, which in total account for 0,5% of South Africa’s export share.
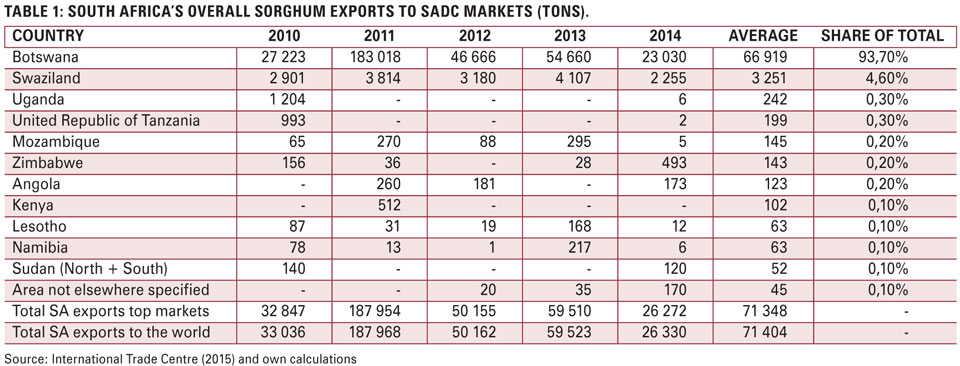
Currently, Botswana’s domestic sorghum production is increasing, which might limit its import needs in future. International Trade Centre (2015) data shows that South Africa’s exports’ share in Botswana has been decreasing. From 2010 to 2014, the quantity of South African exports to Botswana decreased by 15%.
South Africa’s sorghum exports within the global context
In value terms, South Africa is the seventh largest exporter of sorghum in the world, after the United States of America, Argentina, Australia, the Ukraine, France and India (ITC, 2015). Global sorghum exports are concentrated within the top six largest exporters (which are the United States of America, Argentina, Australia, the Ukraine, France and India) which account for 94% of the total global exports.
Who are the leading global importers of sorghum?
There are 16 African markets that rank among the top 50 sorghum global importers. On average, African markets account for 10% of the global import demand. Sudan and Ethiopia are the largest markets on the continent. However, they each account for just 2% of the global import demand.
Outside the continent, Japan, China, Mexico and Colombia are the leading sorghum importing markets, all constituting more than 73% of the global import demand. In particular, Japan and Mexico are the leading importers of sorghum in the world. They both account for 55% of the world’s sorghum imports. The top 20 sorghum import markets account for 95% of the global import demand.
Emerging markets have also been among the fastest growing regions for sorghum imports. The Middle East (25%), Asian and Far East markets (36%) showed significant growth between 2009 and 2013.
Above all, Europe has shown the most impressive growth, with imports increasing by an annual average of 54% over the same period (2009 to 2013). Global import demand is also increasing – in the same period, the increase was 17,6%.
Diversifying export markets: Where are new potential markets for sorghum exports?
Sorghum potential export markets are identified through the growth share matrix (see Figure 1). The countries are grouped and classified according to their growth in import demand and their relative share of global imports.
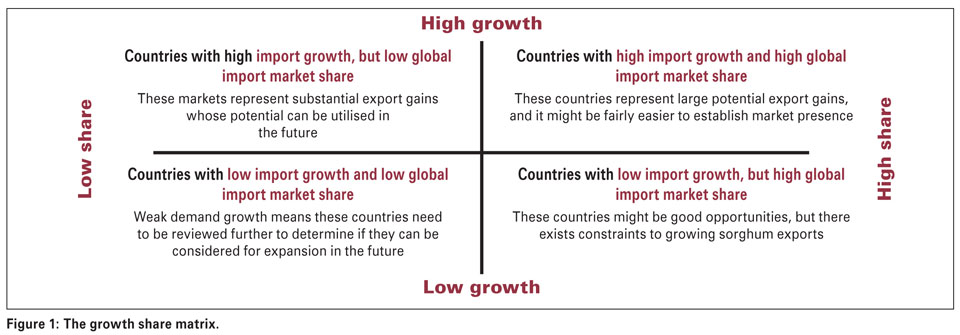
Figure 1 defines the category under which each country’s market falls by taking the top 50 global sorghum importers. These can be considered as:
This analysis mainly takes into account the trade flows without emphasis on the non-tariff barriers such as genetically modified organism (GMO) restrictions. The high growth market represents a country whose growth in imports is greater than the global average growth of 17,6%. The high share market represents a country whose share of global imports exceeds the share of South Africa's exports in the world market, which is 1,4%.
The growth share matrix
The outcome of the analysis is presented in Figure 2. Within the continent, Cameroon, Sudan and Ethiopia are the only countries that show the greatest potential for an export expansion strategy. Sudan and Ethiopia are the strongest options because they have significantly lower tariff barriers, compared to Cameroon.
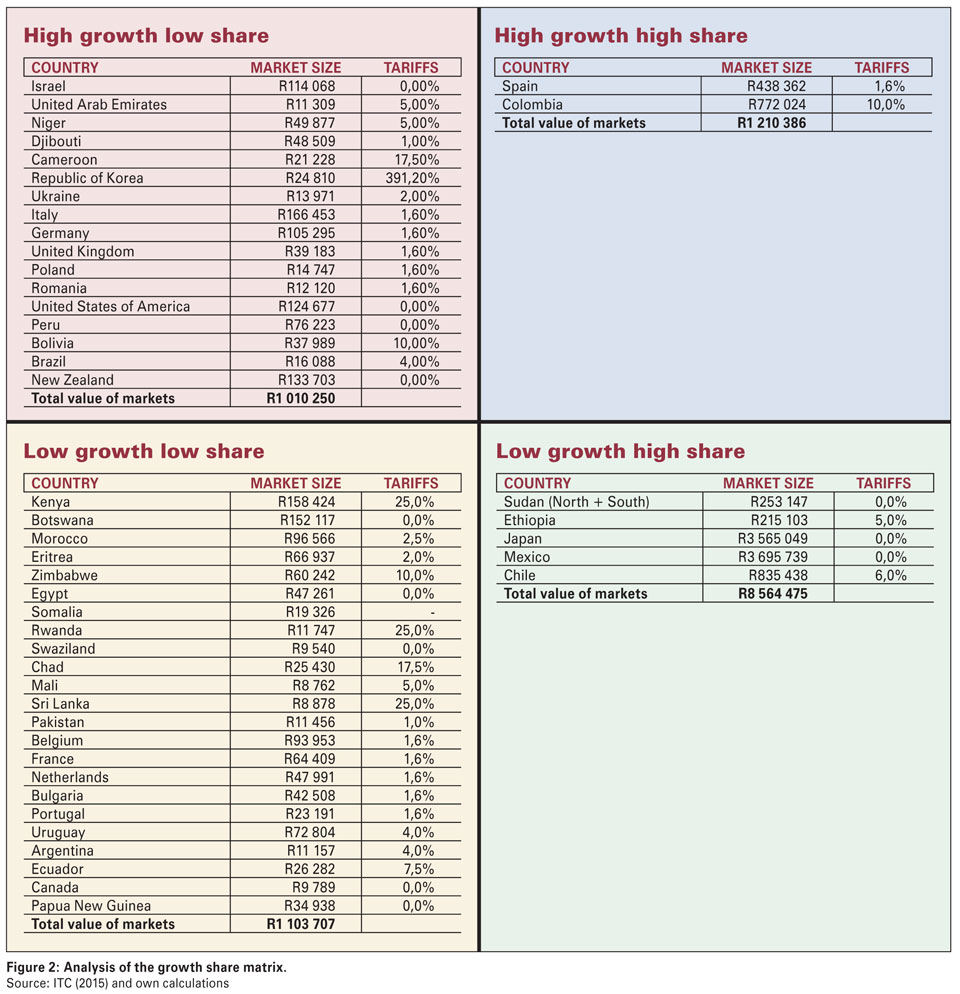
Globally, Japan and Mexico are the large markets, with zero-rated tariffs for South African sorghum exports. However, there are still major concerns regarding the competitiveness of South Africa in these respective markets, more specifically the supply requirements. Europe also presents several options for South Africa (Figure 2).
Nevertheless, the same concerns of competitiveness and supply requirements remain. South Africa’s sorghum enters Europe at a modest duty of 1,6% under the Trade and Development Cooperation Agreement (TDCA). Moreover, Israel, Peru, the United States of America and New Zealand are duty free markets and hence also need to be further reviewed.
To conclude
The focus for export expansion should be more on the Far East, specifically Japan, as well as in Europe, but also not ignoring the African markets such as Sudan and Ethiopia. However, there might be some non-tariff barriers in these markets.
There is a need for a non-tariff barrier study to look at the considered markets through a country-by-country approach.
Publication: June 2015
Section: On farm level
