- Follow us:
- Our Commodities:
-
June 2015
CORINDA ERASMUS, STEPS Science Training and WIANA LOUW, general manager: Southern African Grain Laboratory
What is data mining? Data mining is the practice of examining large pre-existing databases with the objective to generate new information. Modern data mining software allows users to analyse data from many different angles, categorise it and summarise the relationships identified.
Although data mining is a relatively new term, the technology is not. For many years, for example, companies have used powerful computers to sift through volumes of supermarket scanner data and analyse market research reports. However, the continuous innovation in computer processing power, disk storage, and user-friendly statistical software resulted in dramatic increases in the accuracy of analyses while driving down the cost.
It opens up new possibilities for new applications in disciplines such as agriculture and food science. Data mining is primarily used today by companies with a strong consumer focus – retail, financial, communication, and marketing organisations. With the increased focus on the requirements of customers in the agricultural industry, data mining can be used to determine trends in the quality of produce as influenced by factors such as rainfall patterns or farming practices.
With the financial support of the different agricultural trusts, annual crop quality surveys on the major South African crops (maize, wheat and more recently oilseeds and sorghum) are being conducted. Several production seasons’ data (in some cases, such as maize and wheat, almost two decades of data) are available on crop samples that have been collected at silo points throughout the country.
In a pilot project on maize, the Southern African Grain Laboratory (SAGL) was tasked with the development of a data mining protocol that can provide user-friendly results suitable for use by industry stakeholders including millers, feed manufacturers and seed breeders among others. Data from the maize crop (both white and yellow maize) from eleven seasons (2002/2003 to 2011/2012) was used for this study. More than ten thousand samples were included.
Data mining analyses levels
Various levels of analyses can be used. These include artificial neural networks, genetic algorithms, and decision trees, such as classification and regression trees (CART) and Chi Square Automatic Interaction Detection (CHAID). These are then linked with data visualisation which is the visual interpretation of complex relationships in multidimensional data. Powerful modern graphics tools are used to illustrate these data relationships.
Maize crop quality survey data at the SAGL
One of the challenges with crop quality survey data is that data sets are skew since some regions have more than 300 sampling points while others have less than 50.
This is a result of certain areas in the country being more suitable for producing a specific crop than others, and therefore having more silo points as a result. In order to develop the statistical models, it was necessary to take a sub-sample of data points using a randomised stratified design for the data.
For both yellow and white maize more than 2 000 samples each were selected for the balanced data sheets.
Integrating GIS software to present crop quality survey data
Historically, the data was presented in table format showing mean values and standard deviations of results for region and annually published as such. A new innovative method had to be developed to see trends spanning many years, which is not possible in a table format.
The SAGL, in collaboration with the company SIQ, explored the possibility of developing a GIS map system where grain production regions are presented on a map of South Africa, with the production region boundaries illustrated along their specific co-ordinates. The silo industry assisted the SAGL and SIQ with the required coordinate data.
With these maps, the results of the crop quality traits can then be represented in a colour scale format – the highest values have the darkest colours and the lowest values, the lightest colours. SIQ created a custom software package based on an open source GIS package (QGIS) specifically for pre-setting crop quality survey data.
The package requires Windows (Access and Excel) interfaces and is relatively easy to implement. The data from the selected eleven year period was then analysed further. The objective was to look for pointers towards areas where specific traits may be consistently higher or lower than the average when compared with other areas.
For example, if a specific area always has the highest protein value irrespective of the season, it points towards something unique in that region influencing the value, and for this a liberal ANOVA test such as the Fisher LSD test was used on the stratified data set and integrated with the GIS software. Other statistical tests (parametric and non-parametric) can also be integrated if needed.
Trends observed over the past decade
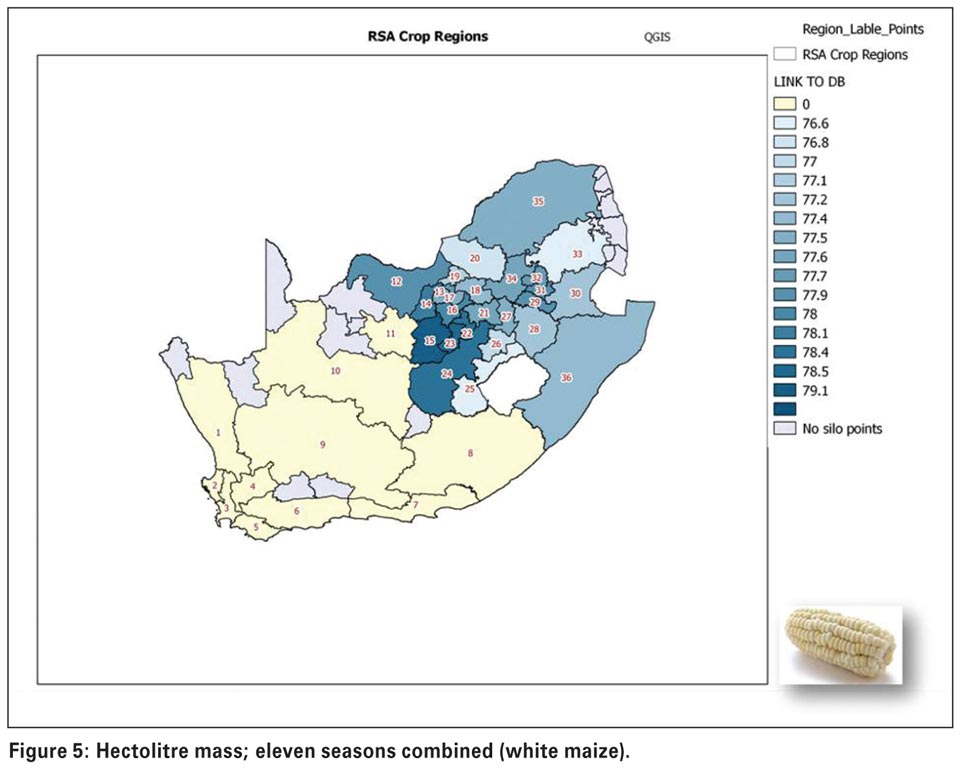
In the examples shown here we have chosen percentage protein, percentage starch, hectolitre mass and milling index to illustrate the power of the new system. After completion of the ANOVA test, areas that were not statistically different from each other were assigned the same colour. Figure 1 and Figure 2 show the map distributions for protein.
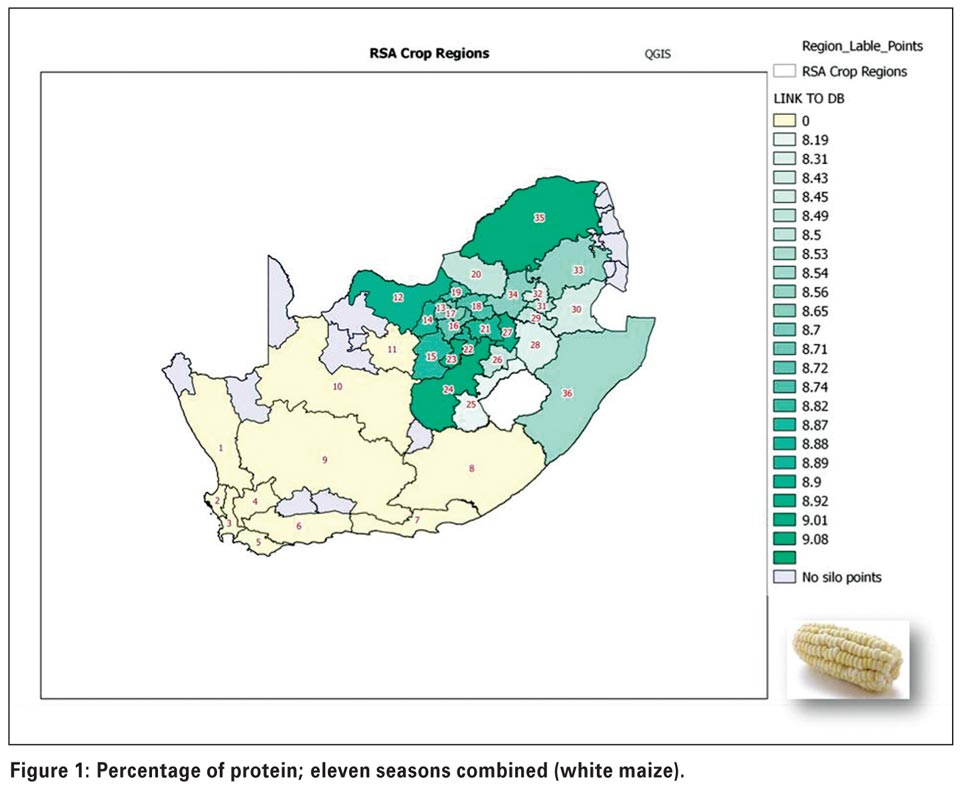
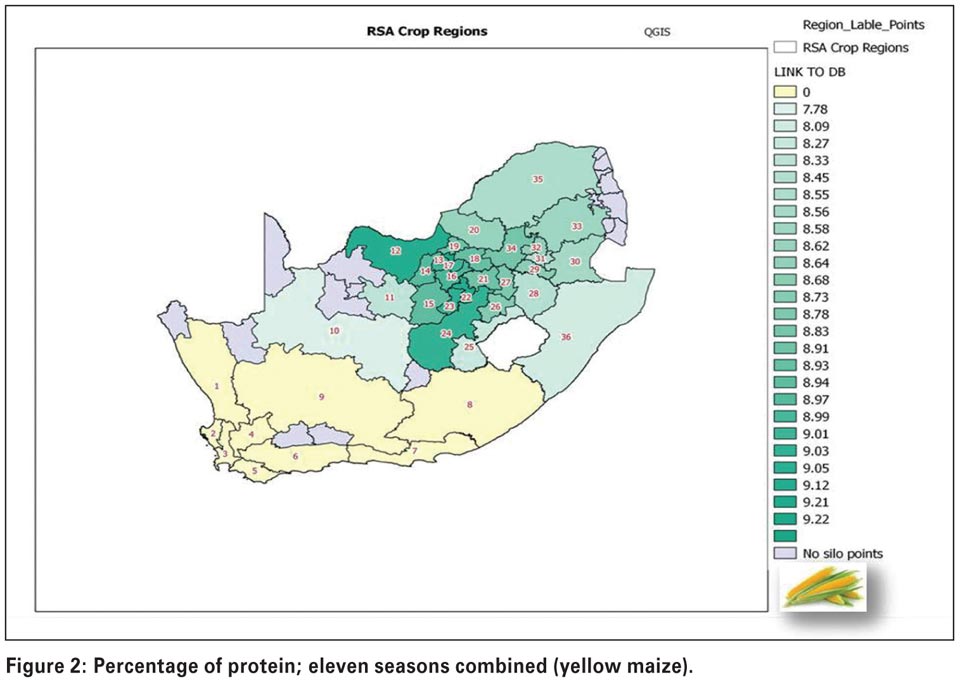
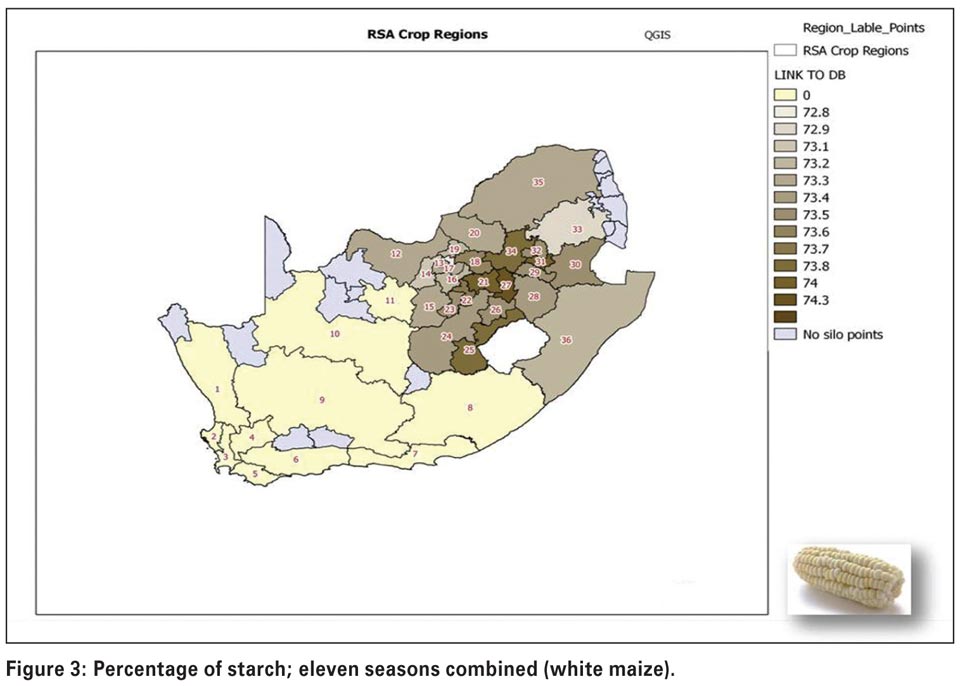
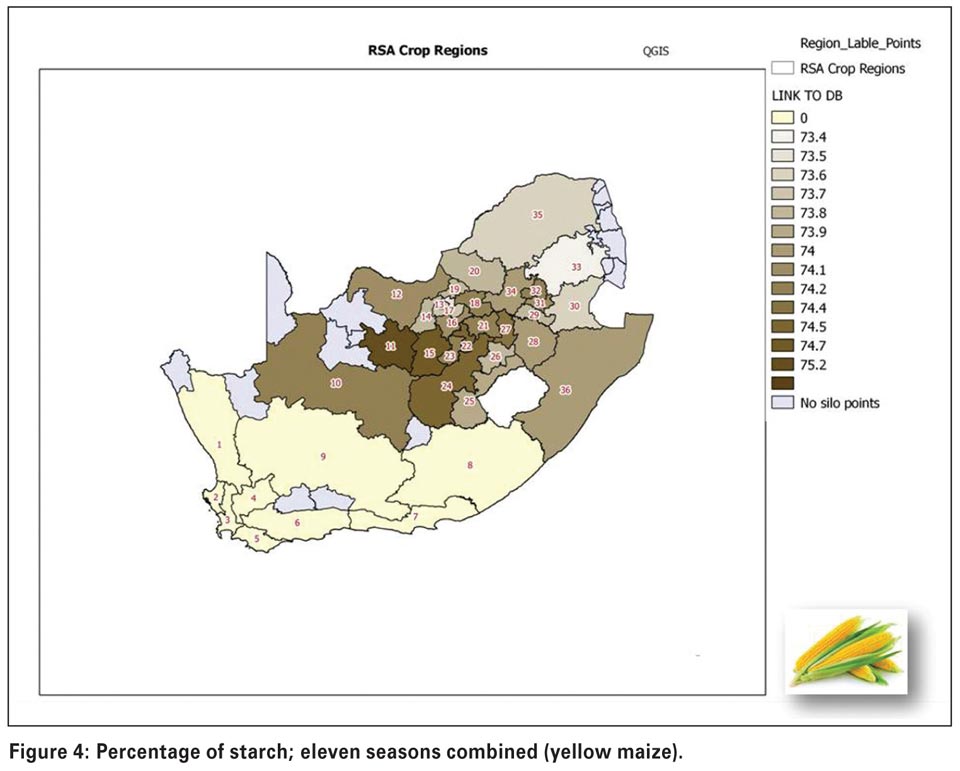
Higher protein levels tend to be found in the western parts of the country. On the other hand, higher starch levels (Figure 3 and Figure 4) can be seen in more of the central and escarpment regions, as well as regions where more production takes place under irrigation, for example close to the Gariep dam (regions 11 and 15). Many factors can influence protein and starch contents in maize, for example higher rainfall tends to produce lower protein levels and more starch.
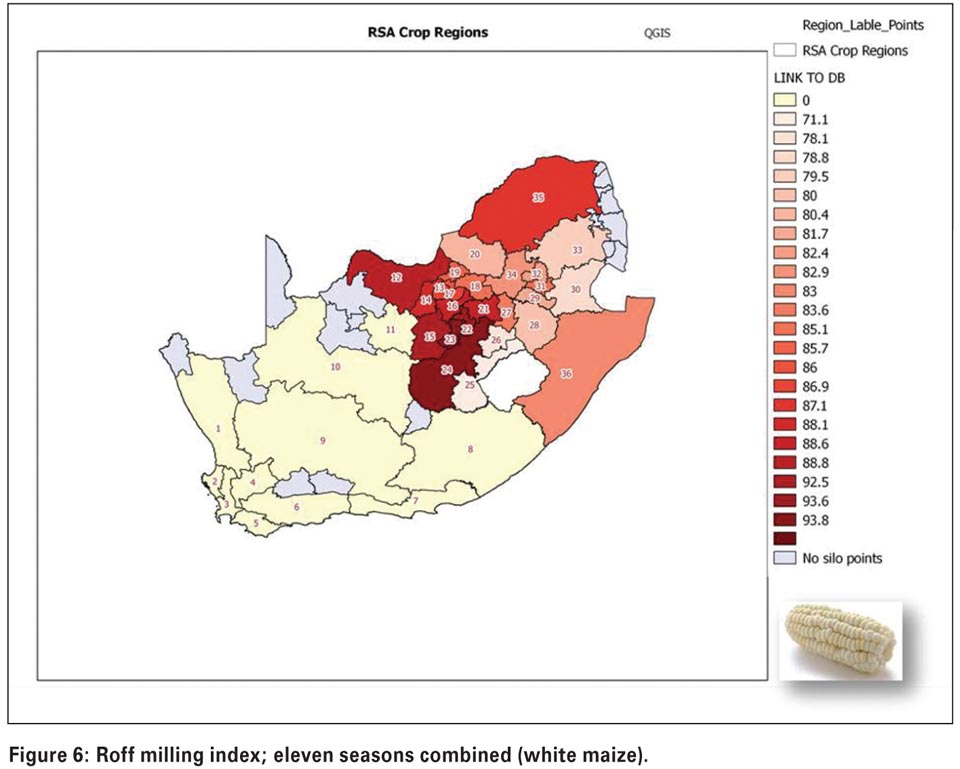
Soil conditions such as pH and levels of micronutrients will also have a significant effect. Hectolitre mass (Figure 5) is higher in the western parts and milling index (Figure 6) as an indication of milling quality and an important quality trait for millers, is also higher in the western areas.
The project is now at a stage where more in-depth studies are being planned in order to explain trends observed on a regional level.
These maps will be updated every year and the objective is to develop a system where it can be made available online as interactive maps. Similar maps for other maize quality traits (grading results and percentage bran) are available for the same period.
Using advanced data mining tools
Further analyses of the data can be done using principal component analyses (for data clustering) and CART trees. The power of using both techniques is that if applied correctly, a similar outcome can be expected.
PCA plots can be very abstract and difficult to interpret, but clusters can be shown as groups of data on a 3D plot. For the crop quality survey data, different seasons appear as distinct groups on a 3D factor plot. It supports the result of a CART tree analysis done where the effects of season, region and continuous parameters, such as percentage protein, were used to predict an outcome such as Milling Index.
For the eleven year test period, and using Milling Index data illustrated in Figure 6 as an example, the most important factor influencing milling quality was season. Hecto litre mass and percentage protein were second and third in terms of importance with the effect of region in fourth place of importance. In combination, these factors then produced highly significant models for future use.
Please contact the SAGL (wiana.louw@sagl.co.za) or Dr Corinda Erasmus (corinda@iburst.co.za) for further details. Explanation of the production regions linked to their numbers can be obtained from www.sagl.co.za.
Publication: June 2015
Section: Focus on
