- Follow us:
- Our Commodities:
-
February 2018
The National Crop Statistics Consortium (NCSC) updates the national field boundary data set annually for the Crop Estimate Committee (CEC) at the Department of Agriculture, Forestry and Fisheries (DAFF). GeoTerraImage, as part of the NCSC, is responsible for this process and uses earth observation satellites as a base layer for this process. Earth observation satellites, with their ability to record data regularly over vast regions, makes it efficient and a very useful tool to monitor large areas of agricultural cultivation.
This has allowed the update and maintenance of field boundary changes for the CEC since 2007 using Spot 5 satellite imagery annually, which includes centre pivot irrigation fields. Field boundaries were mapped by GeoTerraImage for the year 1990 using Landsat 5, and similarly using Landsat 7 imagery for the year 2000.
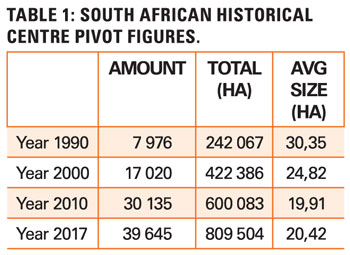 The evolution of irrigation practices is clearly illustrated in Table 1 for the 27-year period from 1994 to 2017, with a total increase of 31 669 fields amounting to 567 437 ha. Each of the time intervals shows a constant increase in fields converted to centre pivot irrigation, or the construction of new centre pivots. It is also evident that the average size of hectares under centre pivots decreased from 30,4 ha in 1990 to 20,4 ha in 2017.
The main component of centre pivot irrigation is grain and oilseed crops (maize, wheat, soybeans, sorghum, sunflower and groundnuts), which amounts to approximately 450 000 ha annually. Grain and oilseeds under centre pivots contributed 70% to the total area planted under centre pivots in South Africa during 2010 from where it decreased to around 55% during 2017.
Other irrigated crops include lucerne (estimated at 20 000 ha), planted pasture, and vegetables such as potatoes (estimated at 40 000 ha - 45 000 ha). Sugar cane is either partially or fully irrigated and constitutes approximately 270 000 ha of which 16 600 ha
is under centre pivot irrigation.
Fruit orchards are also irrigated, but mostly through drip or micro systems and have grown from just more than 400 000 ha in 1990 to a current area of more than 470 000 ha. Although centre pivot irrigation shows a continuous increase, a crop such as cotton has decreased from 4 085 ha in 2010 to 2 424 ha in 2017.
It also has to be noted that not all centre pivots are irrigated every year, while in other cases some centre pivots are planted in winter and summer on a ‘double cropping’ practice.
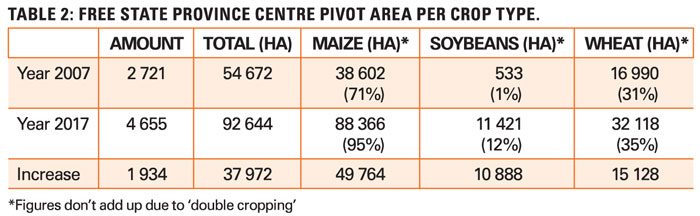
At a provincial level, the Free State has followed a similar trend as shown in Table 1 for South Africa, with an increase of 1 934 centre pivot fields or 37 972 ha for the decade from 2007 to 2017.
During this time, the cultivation of crops such as maize, soybeans and wheat under centre pivot irrigation has shown significant growth, as illustrated in Table 2. Soybeans has shown the largest growth on a percentage base, while maize cultivation represented the largest irrigated area in the Free State.
The ability of earth observation systems to record imagery regularly over time allows historical and real-time analysis of farming practices, cultivation patterns and crop type trends as illustrated above in the analysis of centre pivot irrigation growth in South Africa over a 27-year period.
Publication: February 2018
Section: On farm level
