- Follow us:
- Our Commodities:
-
December 2023
| JOHAN TEESSEN, ECONOMIST INTERN, GRAIN SA |
 |
In the biggest part of the maize production area, the planting season is over. Let’s look back on the 2022/2023 maize season.
When looking back at this season, the previous four seasons will be compared to it and broken down into two sections.
DEMAND AND SUPPLY
Graph 1 illustrates the maize demand and supply performance in terms of the opening stock (blue bar), total supply (orange bar), total demand (yellow bar), ending stock (light-blue bar) and the stock-to-use percentage as a green line.
Comparing the opening stock and ending stock, it is clear there was an increasing trend from the 2020/2021 season onwards until 2022/2023. This trend is also visible in the total supply, but only from the 2019/2020 season until 2021/2022. In the 2022/2023 season, there will be a lower supply number due to fewer plantings and, therefore, a lower opening and ending stock for the 2023/2024 season.
The rule of thumb is that the stock-to-use percentage should be about 12% for it not to have a downward effect on prices. As can be seen in Graph 1, the stock-to-use percentage is higher than 20%, which means that there is an overproduction of maize and it must be exported. The 2023/2024 season is estimated to have a stock-to-use percentage of 19%, which is not great compared to the rule of thumb but better than the 27% of the previous season.
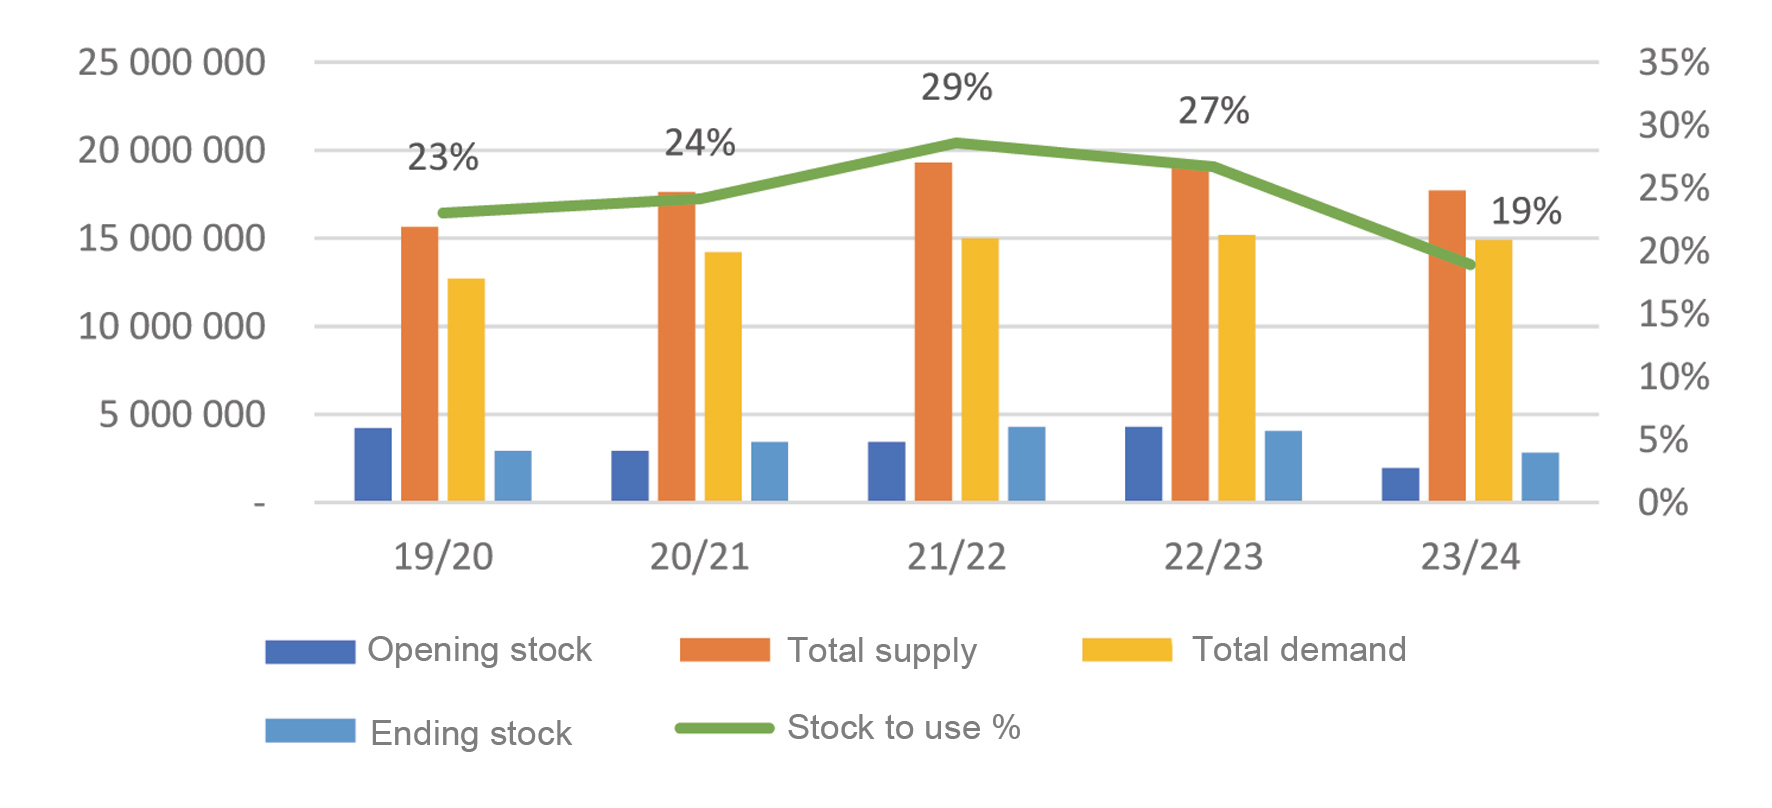
Maize demand and supply.
PROCESSED AND EXPORTED
Graph 2 illustrates the maize processed and exported, which includes human consumption (blue bar), animal/industry consumption (orange bar) and exports (grey bar).
From the 2019/2020 season onwards, the exports increased until the 2022/2023 season, which is correlated with the stock-to-use ratio in Graph 1. When the stock-to-use ratio was at its highest, the exports were also at their highest.
It is important to note that in the 2023/2024 season, exports are estimated to decline with the stocks-to-use ratio due to the estimated supply of maize being lower. The graph shows that animal and industry consumption has stayed relatively constant over the five seasons, while human consumption varies from one season to the next.
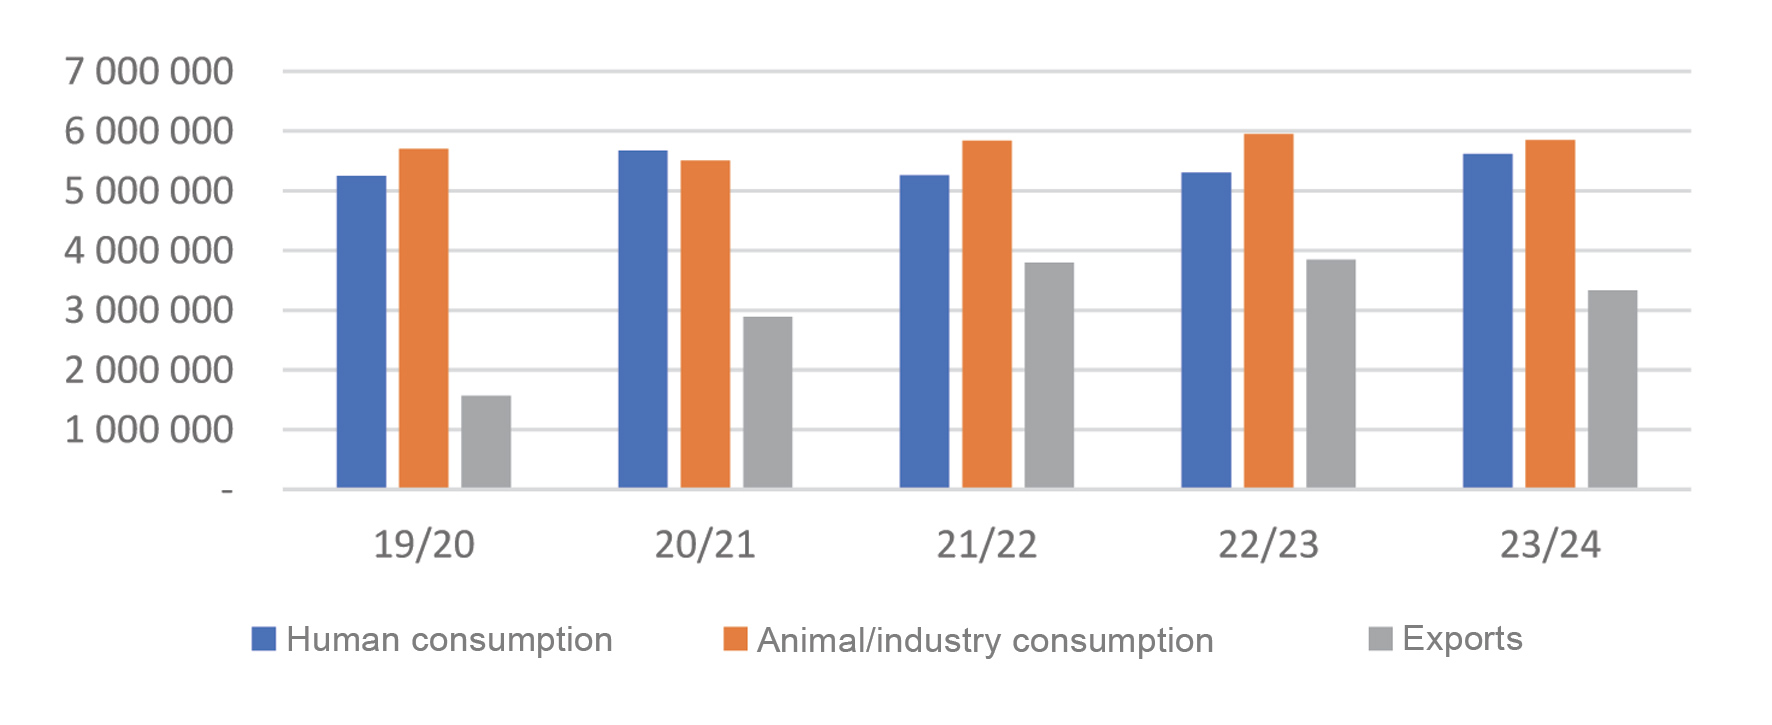
Maize processed and exported.
CONCLUSION
The 2022/2023 season has been a competitive season in terms of production and demand, although the stock-to-use ratio has declined. In the context of maize processed and exported, it had almost the same exports as the previous season. With the 2023/2024 season, it is estimated that the exports and supply will be lower, although the demand will stay the same, resulting in a lower stock-to-use percentage.
Publication: December 2023
Section: Pula/Imvula
