- Follow us:
- Our Commodities:
-
June 2012
JOLANDA NORTJÉ, MANAGER LABORATORY, SOUTHERN AFRICAN GRAIN LABORATORY
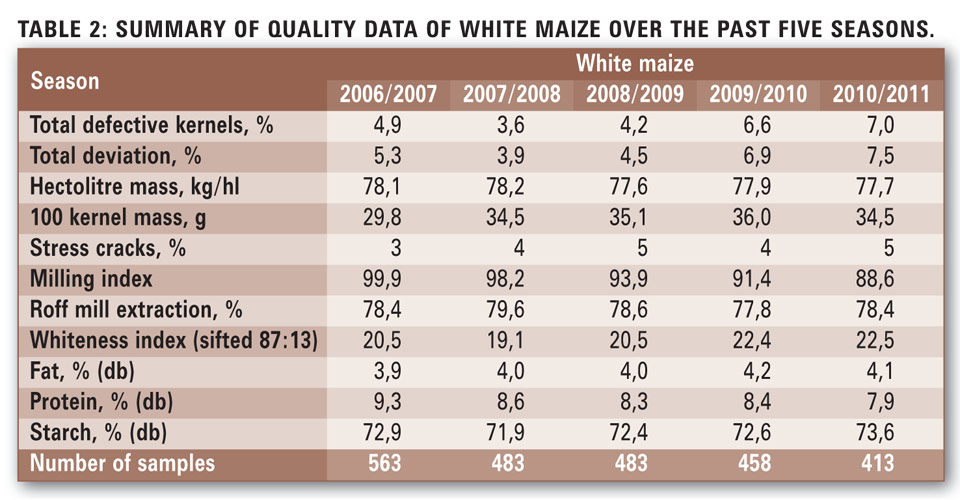
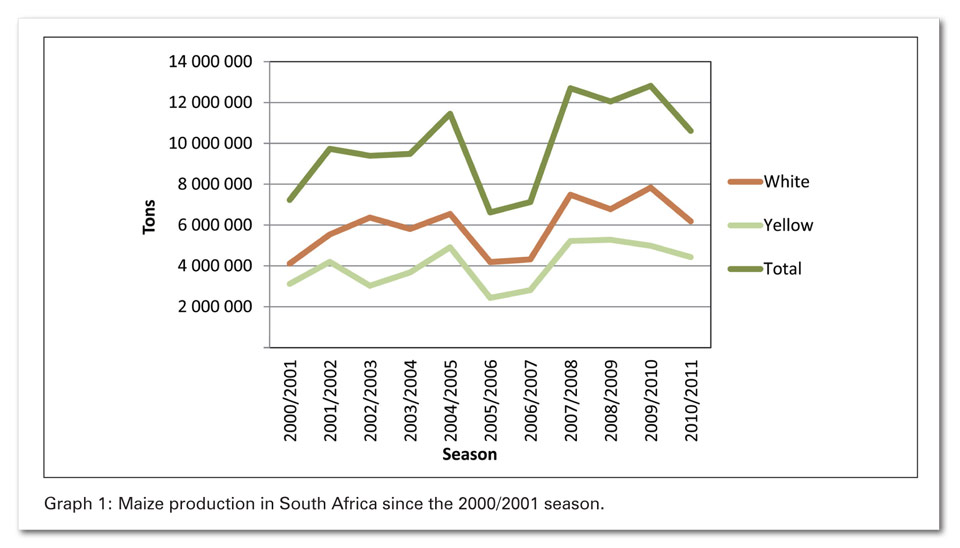
The final commercial maize crop figure for the 2010/2011 season as calculated by the National Crop Estimates Committee, was 10 360 000 tons of which 58% was white maize. 693 composite samples were analysed by the South African Grain Laboratory (SAGL) to obtain a proportionate representation of the quality of locally produced maize.
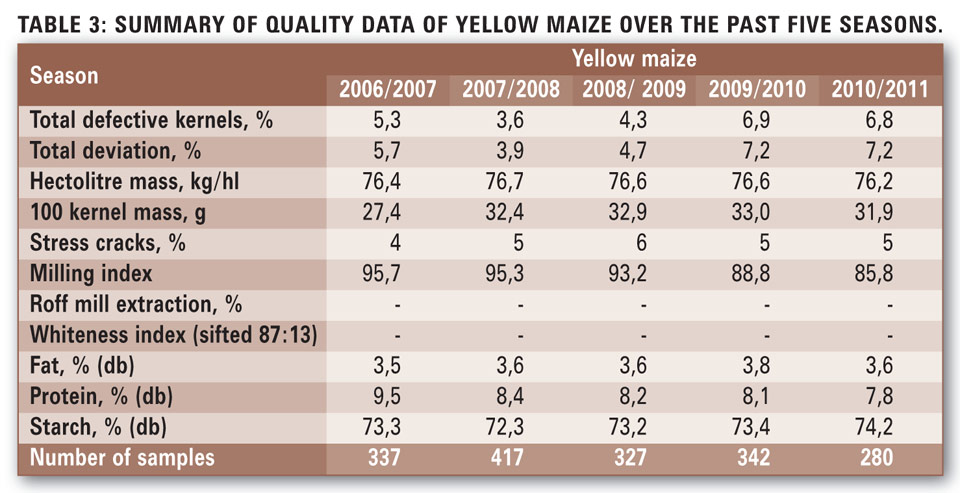
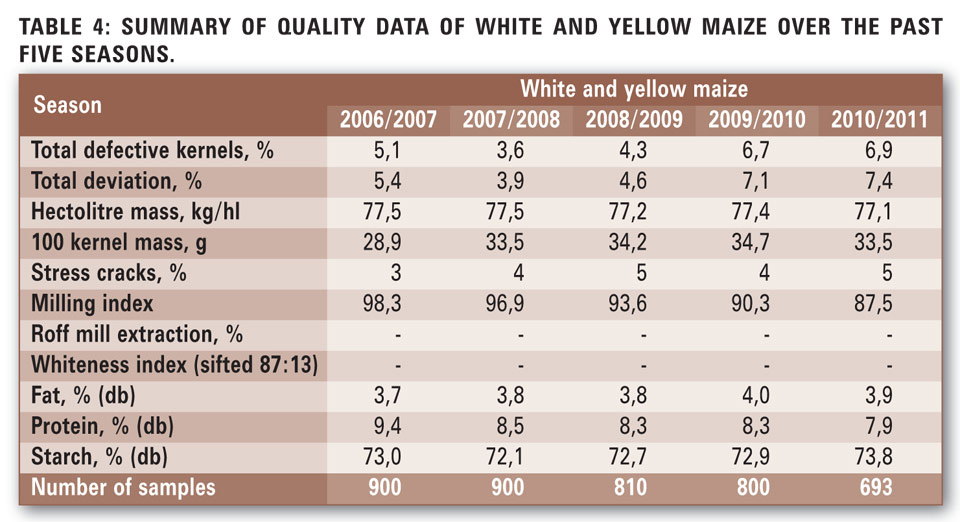
The maize crop was of average good quality; with 69% of the samples graded as maize grade one. For more detailed information on the quality of the 2010/2011 crop samples, please see Table 1 for a summary of the quality data per class and grade. Tables 2 to 4 compare the quality data of white, yellow as well as white and yellow maize over the past five seasons.
Although the percentages mould infected kernels increased slightly compared to the previous season (Diplodia infected kernels with 0,4% and Fusarium with 0,2%), the average mycotoxin levels were lower than in previous seasons.
The average Fumonisin level was 139 μg/kg (ppb), the average Deoxynivalenol (DON) level 49 μg/kg and the average Zearalenone level 5 μg/kg. These values are well within the maximum levels specified by the European Union and the USA. No Aflatoxin, Ochratoxin A or T-2 Toxin was detected on any of the 77 samples analysed as part of this crop survey.
The EnviroLogix QuickComb kit for bulk grain was used to quantitatively determine the presence of Cry1Ab (MON810) and CP4 EPSPS (Roundup Ready) genetically modified maize in the above mentioned 77 samples. Cry1Ab protein in maize is produced from a gene derived from Bacillus thuringiensis (Bt). 97% of the samples tested positive for Cry1Ab with values larger than 0,4% (limit of quantification [LOQ]) and 88% of the samples tested positive for CP4 EPSPS with values larger than 0,05% (LOQ).
According to SAGIS, 208 465 tons of yellow maize have been imported from Romania and the Ukraine from 1 May 2011 up to 23 March 2012.
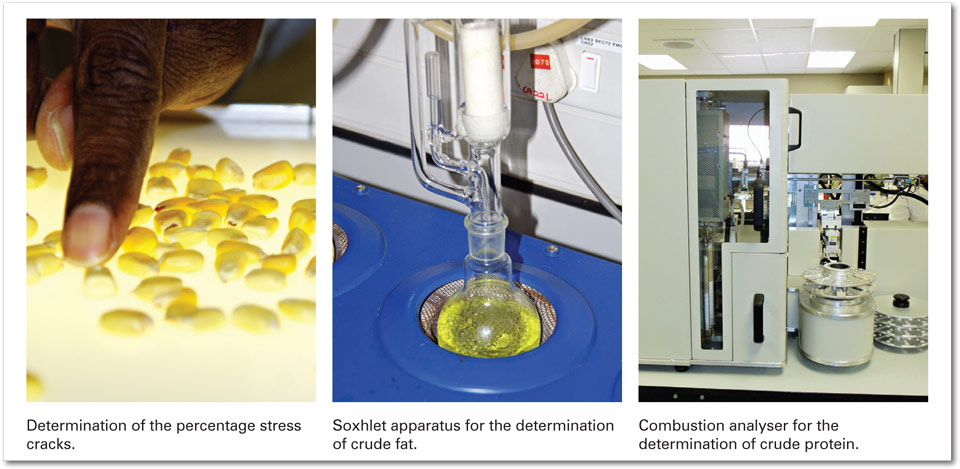
96 419 tons of white maize have been imported from Zambia during the same period. Quality data from Romania and the Ukraine are available on the SAGL website. The major downgrading factor of imported maize to YM2 and YM3 grades are the percentage defective kernels below the 6,35 mm sieve. The percentage stress cracks on imported maize was significantly higher than on local maize and as can be expected also the breakage susceptibility.
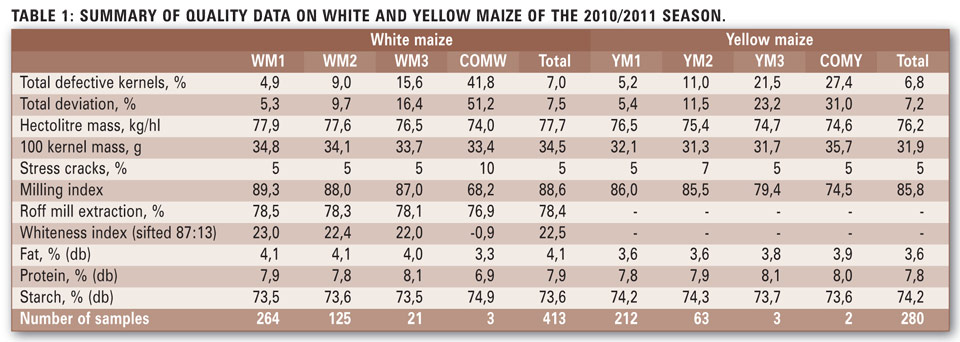
The imported maize kernels are smaller on average than the local maize. The hectolitre and 100 kernel mass of South African maize from corresponding grades (YM2 and YM3) are on average better than that of the imported maize. The average protein and starch contents of local maize and imported maize compare well, while the imported maize tend to have a 0,5% to 0,7% higher fat content.
For more information with regards to the national as well as imported maize quality, please visit the SAGL website at www.sagl.co.za. Quality data is updated on a weekly basis as samples of the new crop is received from the grain storers and as samples of imported maize are received from the different harbours. Crop reports of previous seasons can be downloaded in a PDF format or alternatively contact SAGL at info@sagl.co.za.
Acknowledgements
With gratitude to the Maize Trust for financial support in conducting this annual survey as well as to the Grain Silo Industry and the National Chamber of Milling and their members for providing the samples that make this survey possible.
With gratitude to the Maize Trust for financial support in conducting this annual survey as well as to the Grain Silo Industry and the National Chamber of Milling and their members for providing the samples that make this survey possible.
Publication: June 2012
Section: Other Articles
