- Follow us:
- Our Commodities:
-
August 2018
South African soybean production responded positively to the large investments that were made to construct new crushing capacity, with the latest production forecast for soybeans being the largest in the history of South Africa. The total area cultivated with soybeans has increased significantly since 2007, due to the increased crushing capacity and crop rotation advantages of soybeans.
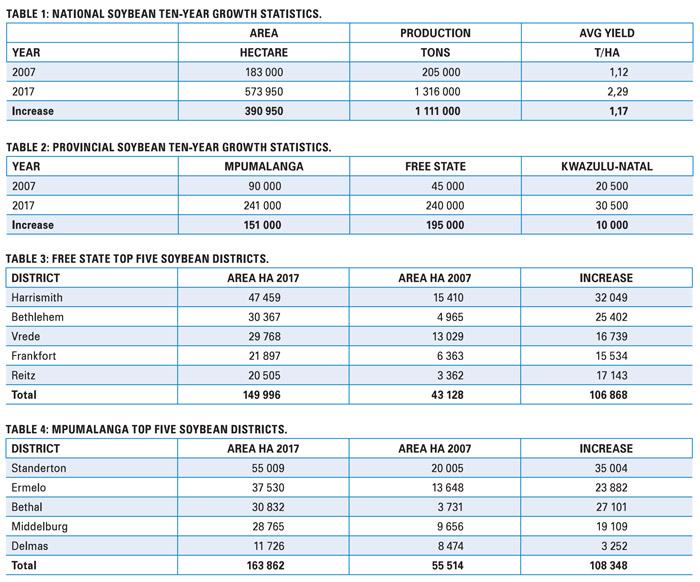
The Crop Estimates Committee (CEC) at the Department of Agriculture, Forestry and Fisheries (DAFF) estimated the total hectares of soybeans planted in 2007 at 183 000 ha (CEC: 2 October 2007) producing 205 000 tons. Ten years later, in 2017, the CEC estimated the total area planted at 573 950 ha (CEC: 28 September 2017), which produced 1 316 000 tons of soybeans.
These figures show an increase of almost 400 000 ha over the ten-year period, while producers have succeeded in more than doubling the average yield per hectare from 1,12 t/ha to 2,29 t/ha, as summarised in Table 1.
The three main soybean producing provinces, Mpumalanga, Free State and KwaZulu-Natal (Table 2) have followed the national trend over the past decade and have also experienced increased soybean cultivation.
Free State province has shown tremendous growth – from only 45 000 ha in 2007 to 240 000 ha in 2017 – which is five times more and an increase of 195 000 ha. Mpumalanga also experienced significant growth, and although not at the same rate as the Free State, these two provinces are responsible for approximately 85% of soybean cultivation in South Africa.
The abovementioned information is partly based on the field boundary framework mapped by the National Crop Statistics Consortium (NCSC) for the CEC at DAFF. GeoTerraImage, as part of the NCSC, is responsible for this process and uses Earth Observation satellites as a base layer to perform this mapping update.
Earth Observation satellites, with their ability to record data regularly over vast regions, prove to be very useful and efficient to monitor large areas of agricultural cultivation. GeoTerraImage uses Earth Observation satellites such as Sentinel 2 and Landsat 8 to perform crop type classifications of individual fields and to analyse cropping patterns.
Crop type information at field level provides the opportunity to summarise crop area at district level to analyse the distribution and area planted for an individual province. This analysis for the Free State shows that Harrismith, Bethlehem, Vrede, Frankfort and Reitz were the top five districts in 2007 and are still producing the most soybeans, as illustrated in Table 3.
Similarly in Mpumalanga the top five producing districts in 2007 were Standerton, Ermelo, Bethal, Middelburg and Delmas. These districts are still the top five and account for 68% of soybean cultivation in Mpumalanga, as shown in Table 4.
The ability of Earth Observation systems to record regular satellite imagery allows real time analysis of farming practices, cultivation patterns and crop type trends as illustrated above in the analysis of soybean growth in South Africa over a ten-year period.
This increased production over the past ten years has several advantages for South Africa, including the reduction of our dependence on imports and more specifically soybean oil and oilcake imports.
For more information on earth observation of agricultural cropping patterns, contact Fanie Ferreira at fanie.ferreira@geoterraimage.com.
Publication: August 2018
Section: Mini-Focus on Soybeans
