- Follow us:
- Our Commodities:
-
September 2018
 During the 2017/2018 production year (October 2017 - September 2018) South Africa planted 497 600 ha of wheat. This is significantly lower than previous years.
The declining trend in hectares is due to a decrease in profitability of the crop; hence, producers switch to more profitable crops like canola, oats, soybean and maize. This then creates a gap between production and demand, opening up the door to increased imports.
Factors that could help revive the industry include; higher yielding cultivars, changes in wheat grading regulations and end-point royalty for system to counter farm saved seeds.
Final wheat estimates released by the Crop Estimates Committee (CEC) on 27 February 2018, show that production will be 1,5 million tons, which is a 20% decrease from last year, due to extreme weather conditions in the Western Cape. Production in the Western Cape dropped by almost 50% from 1,1 million tons to 586 800 tons in the current marketing year; diminishing yield from 3,4 t/ha to 1,8 t/ha. Fortunately, production in irrigated fields of the Northern Cape increased by 17% to 311 600 tons on higher yields. Due to favourable conditions, production in the Free State increased marginally to 328 000 tons.
Consumption and trade
South Africa’s wheat consumption has increased on average by 1% per annum over the past ten years. Wheat demand during the 2017/2018 marketing year is projected at 3,27 million tons. Wheat and wheat product import forecasts for 2017/2018 is 2,0 million tons, due to the decrease in production in the Western Cape. For the current season over 1,6 million tons has been imported. South Africa acts as a conduit for imported grains and exports to nearby countries in Southern Africa, therefore wheat and wheat product exports are expected to be around 100 000 tons.
Local wheat prices
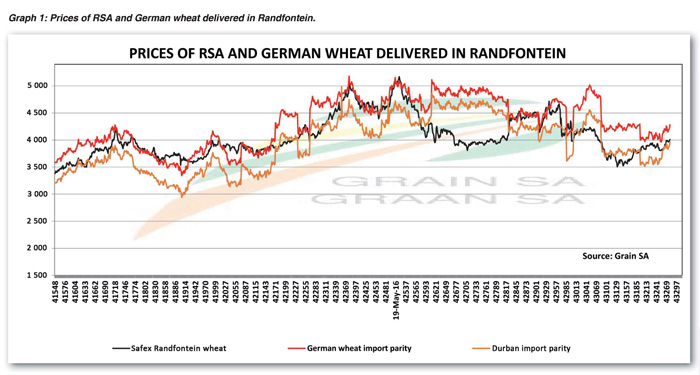
Two factors affect local wheat prices, namely the value of the rand against the dollar and international prices. The rand has been volatile over the past few months while the international prices also found some support. Graph 1 indicates the local wheat prices relative to the German coastal and inland import parity prices. Most of the imports were recently sourced from the EU and Black Sea countries, which means that the local prices are mainly in line with the prices from these origins.
Article submitted by Ikageng Maluleke, Junior Economist, Grain SA. For more information, send an email to Ikageng@grainsa.co.za.
Publication: September 2018
Section: Pula/Imvula
