


 86 / 143

84
Jaarverslag 2018
annual report 2018
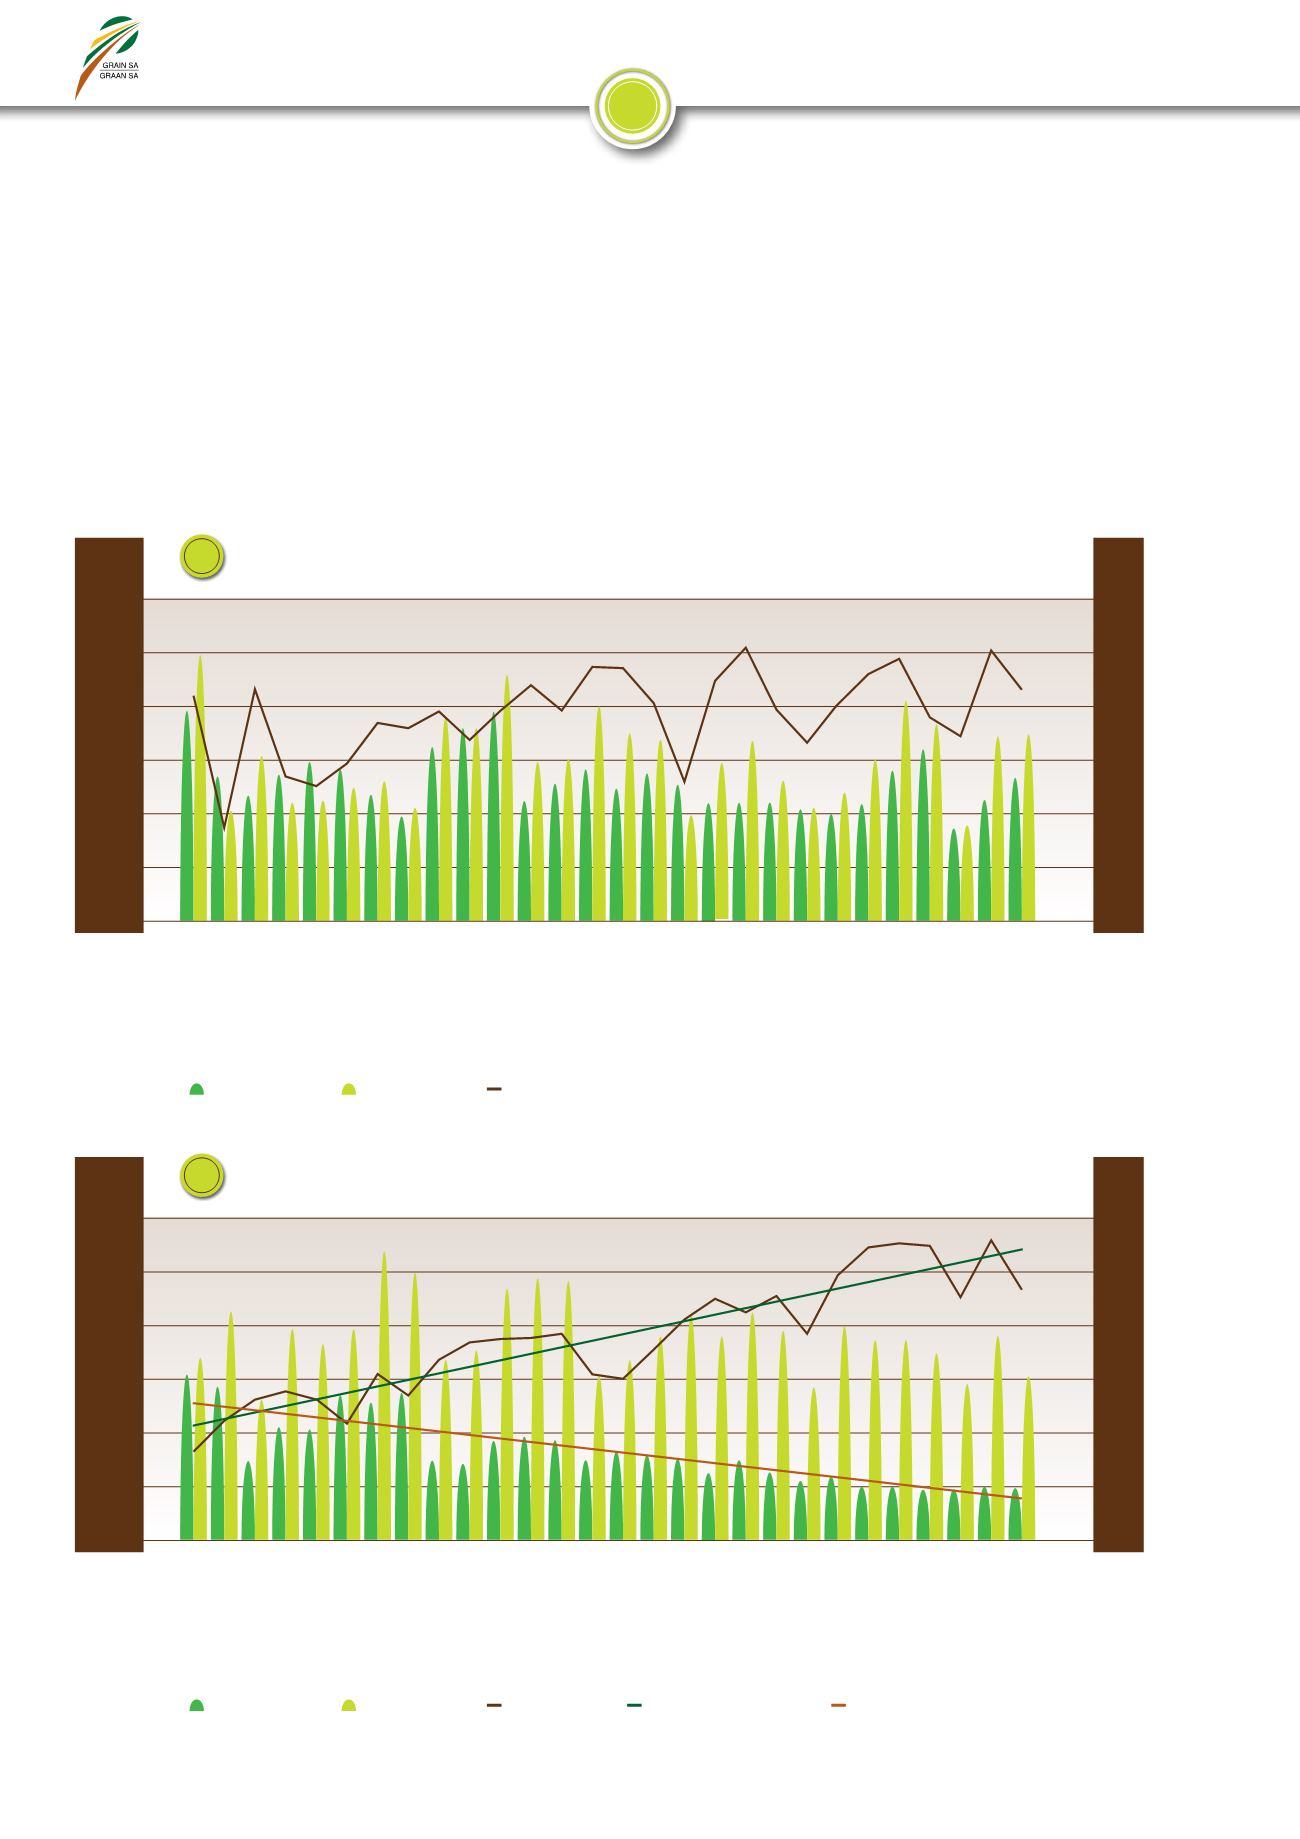
is oorheers deur droogtetoestande. Dit het gelei tot ’n aansienlike daling
in die plaaslike koringproduksie. Die totale oppervlakte van 491 600 ha,
wat gedurende die 2017/2018-seisoen aangeplant is, is ongeveer 3%
laer as die vorige seisoen se aanplantings van 508 365 ha. Die totale
produksie vir die 2017/2018-seisoen kom volgens die NOK se finale
skatting vir wintergrane op 1 535 000 ton te staan. Dit is ongeveer 20%
laer as die vorige seisoen se produksie. Die laer produksie kon grootliks
toegeskryf word aan die droë toestande wat in die Wes-Kaap geheers
het. Hierdie provinsie se totale produksie vir die seisoen is op 586 800 ton
gerapporteer. Dit verteenwoordig ’n daling van 47% vanaf die vorige
seisoen se koringproduksie in die Wes-Kaap. Die gemiddelde opbrengs
vir die 2017/2018-seisoen is as 3,12 t/ha gerapporteer, wat laer is as die
vorige seisoen se gemiddelde opbrengs van 3,76 t/ha. Die Wes-Kaap
The total area of 491 600 ha planted during the 2017/2018 season
was approximately 3% lower than the previous season’s plantings
of 508 365 ha. According to the CEC’s final estimate for winter
grains, the total production for the 2017/2018 season amounted
to 1 535 000 tons. This was approximately 20% lower than the
previous season’s production. The lower production can be largely
attributed to the dry conditions prevailing in the Western Cape.
This province’s total production for the season was reported to be
586 800 tons. This represents a drop of 47% from the previous
season’s wheat production in the Western Cape. The average yield
of 2017/2018 season was reported as 3,12 t/ha, which was lower
than the previous season’s average yield of 3,76 t/ha. The Western
Cape’s average yield for the season was 1,8 t/ha, compared to the
1,8
1,6
1,4
1,2
1
0,8
0,6
0,4
0,2
0
t/ha
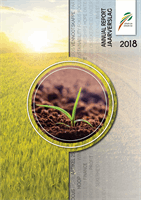
Dry beans area planted and production
Droëboonoppervlakte geplant en produksie
1990/1991
1991/1992
1992/1993
1993/1994
1994/1995
1995/1996
1996/1997
1997/1998
1998/1999
1999/2000
2000/2001
2001/2002
2002/2003
2003/2004
2004/2005
2005/2006
2006/2007
2007/2008
2008/2009
2009/2010
2010/2011
2011/2012
2012/2013
2013/2014
2014/2015
2015/2016
2016/2017
2017/2018*
Area
Oppervlakte
Production
Produksie
Yield
Opbrengs
8
4
3,5
3
2,5
2
1,5
1
0,5
0
t/ha
Wheat area planted and production
Koringoppervlakte geplant en produksie
* Preliminary/Voorlopig
* Preliminary/Voorlopig
1990/1991
1991/1992
1992/1993
1993/1994
1994/1995
1995/1996
1996/1997
1997/1998
1998/1999
1999/2000
2000/2001
2001/2002
2002/2003
2003/2004
2004/2005
2005/2006
2006/2007
2007/2008
2008/2009
2009/2010
2010/2011
2011/2012
2012/2013
2013/2014
2014/2015
2015/2016
2016/2017
2017/2018*
Area
Oppervlakte
Production
Produksie
Yield
Opbrengs
Linear (Area)
Linieêr (Oppervlakte)
Linear (Yield)
Linieêr (Opbrengs)
9
’000 ton
or/of ha
’000 ton
or/of ha
Production years
●
Produksiejare
Production years
●
Produksiejare
120
100
80
60
40
20
0
3 000
2 500
2 000
1 500
1 000
500
0