


 87 / 143

85
Markoorsig vir die 2017/2018-produksieseisoen
Market overview for the 2017/2018 production season
se gemiddelde opbrengs vir die seisoen was 1,8 t/ha teenoor die vorige
seisoen se 3,4 t/ha.
Grafiek 9
toon die koringoppervlakte aangeplant,
produksie en gemiddelde opbrengs sedert die 1990/1991-seisoen.
Moutgars
In die 2017/2018-seisoen is die oppervlakte wat met moutgars be-
plant is as 91 380 ha gerapporteer – wat ’n toename van ongeveer 3%
vanaf die oppervlakte wat gedurende die 2016/2017-seisoen aangeplant
is, verteenwoordig. Die produksie vir die 2017/2018-seisoen was, vol-
gens die NOK se finale skatting vir wintergrane, 307 000 ton – wat 13%
laer is as die vorige seisoen se produksie. Die laer produksie was, ten
spyte van die toename in die oppervlakte wat aangeplant is, ook weer
eens ’n resultaat van die ongunstige produksietoestande wat gedurende
die produksieseisoen in die Wes-Kaap geheers het. Die gemiddelde
opbrengs vir die 2017/2018-seisoen is op 3,36 t/ha gerapporteer – wat
laer is as die vorige seisoen se 3,99 t/ha. Die langtermyngemiddelde
opbrengs van gars is ongeveer 3,3 t/ha.
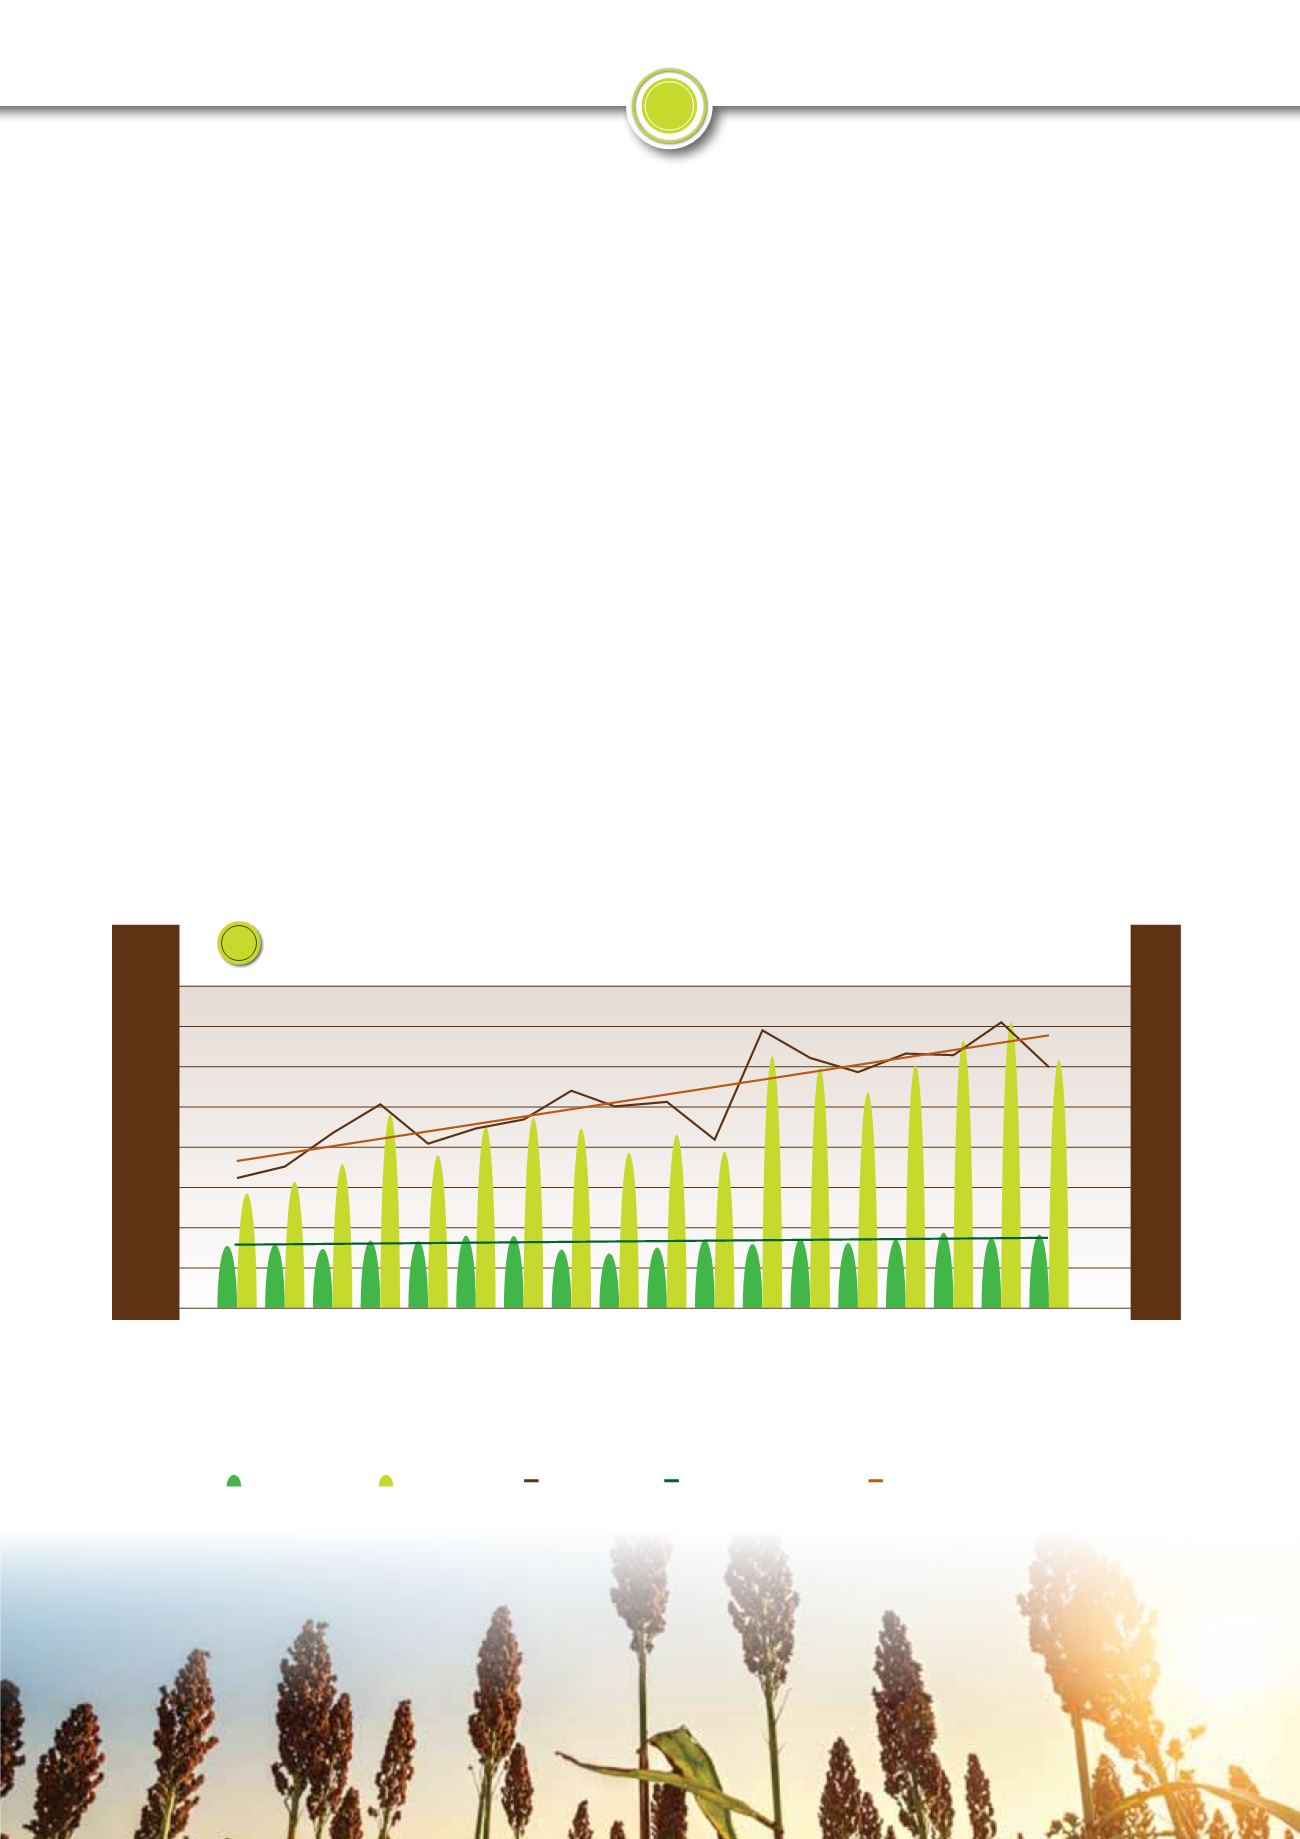
Grafiek 10
toon die oppervlakte
aangeplant, produksie en gemiddelde opbrengs van moutgars sedert
die 2000/2001-seisoen.
Kanola
Grafiek 11
(op bladsy 86) toon die oppervlakte aangeplant, produk-
sie en gemiddelde opbrengs van kanola vanaf 1998/1999-produksiesei
soen tot en met die 2017/2018-produksieseisoen. Die totale oppervlakte
aangeplant het met ongeveer 23% vanaf die 2016/2017-seisoen tot en
met die 2017/2018-seisoen toegeneem en is as 84 000 ha gerapporteer.
Die totale produksie het gedurende hierdie tydperk met ongeveer
11% gedaal en is volgens die NOK se finale produksieskatting vir die
2017/2018-seisoen op 93 500 ton geskat, gemeet teen die vorige
previous season’s 3,4 t/ha.
Graph 9
shows the total area
planted, production and the average yield of wheat since the
1990/1991 season.
Malt barley
In the 2017/2018 season the area planted with malt barley
was reported as 91 380 ha – which represented an increase of
approximately 3% from the area that was planted in the 2016/2017
season. According to the CEC’s final estimate for winter grains, the
production for the 2017/2018 season was 307 000 tons, which was
13% lower than the previous season’s production. In spite of the
increase in the area planted, the lower production was once again a
result of the unfavourable production conditions in the Western Cape
during the production season. The average yield for the 2017/2018
season was reported as 3,36 t/ha, which was lower than the previous
season’s average yield of 3,99 t/ha. The long-term average yield of
barley was approximately 3,3 t/ha.
Graph 10
shows the total area
planted, production and the average yield of malt barley in South
Africa since the 2000/2001 season.
Canola
Graph 11
(on page 86) shows the area planted, production and
average yield of canola from the 1998/1999 production season up to
the 2017/2018 production season. The total area planted from the
2016/2017 season up to the 2017/2018 season increased by about
23% and was reported to be 84 000 hectares. During this period the
total production dropped by about 11%, and according to the CEC’s
second production estimate for the 2017/2018 season was estimated
at 93 500 tons, measured against the 105 000 tons for the previous
* Preliminary/Voorlopig
4,5
4
3,5
3
2,5
2
1,5
1
0,5
0
t/ha
Malting barley area planted, production and yield
Moutgarsoppervlakte geplant, produksie en opbrengs
2000/2001
2001/2002
2002/2003
2003/2004
2004/2005
2005/2006
2006/2007
2007/2008
2008/2009
2009/2010
2010/2011
2011/2012
2012/2013
2013/2014
2014/2015
2015/2016
2016/2017
2017/2018*
Area
Oppervlakte
Production
Produksie
Yield
Opbrengs
Linear (Area)
Linieêr (Oppervlakte)
Linear (Yield)
Linieêr (Opbrengs)
10
’000 ton
or/of ha
Production years
●
Produksiejare
400
350
300
250
200
150
100
50
0