


 83 / 143

81
Markoorsig vir die 2017/2018-produksieseisoen
Market overview for the 2017/2018 production season
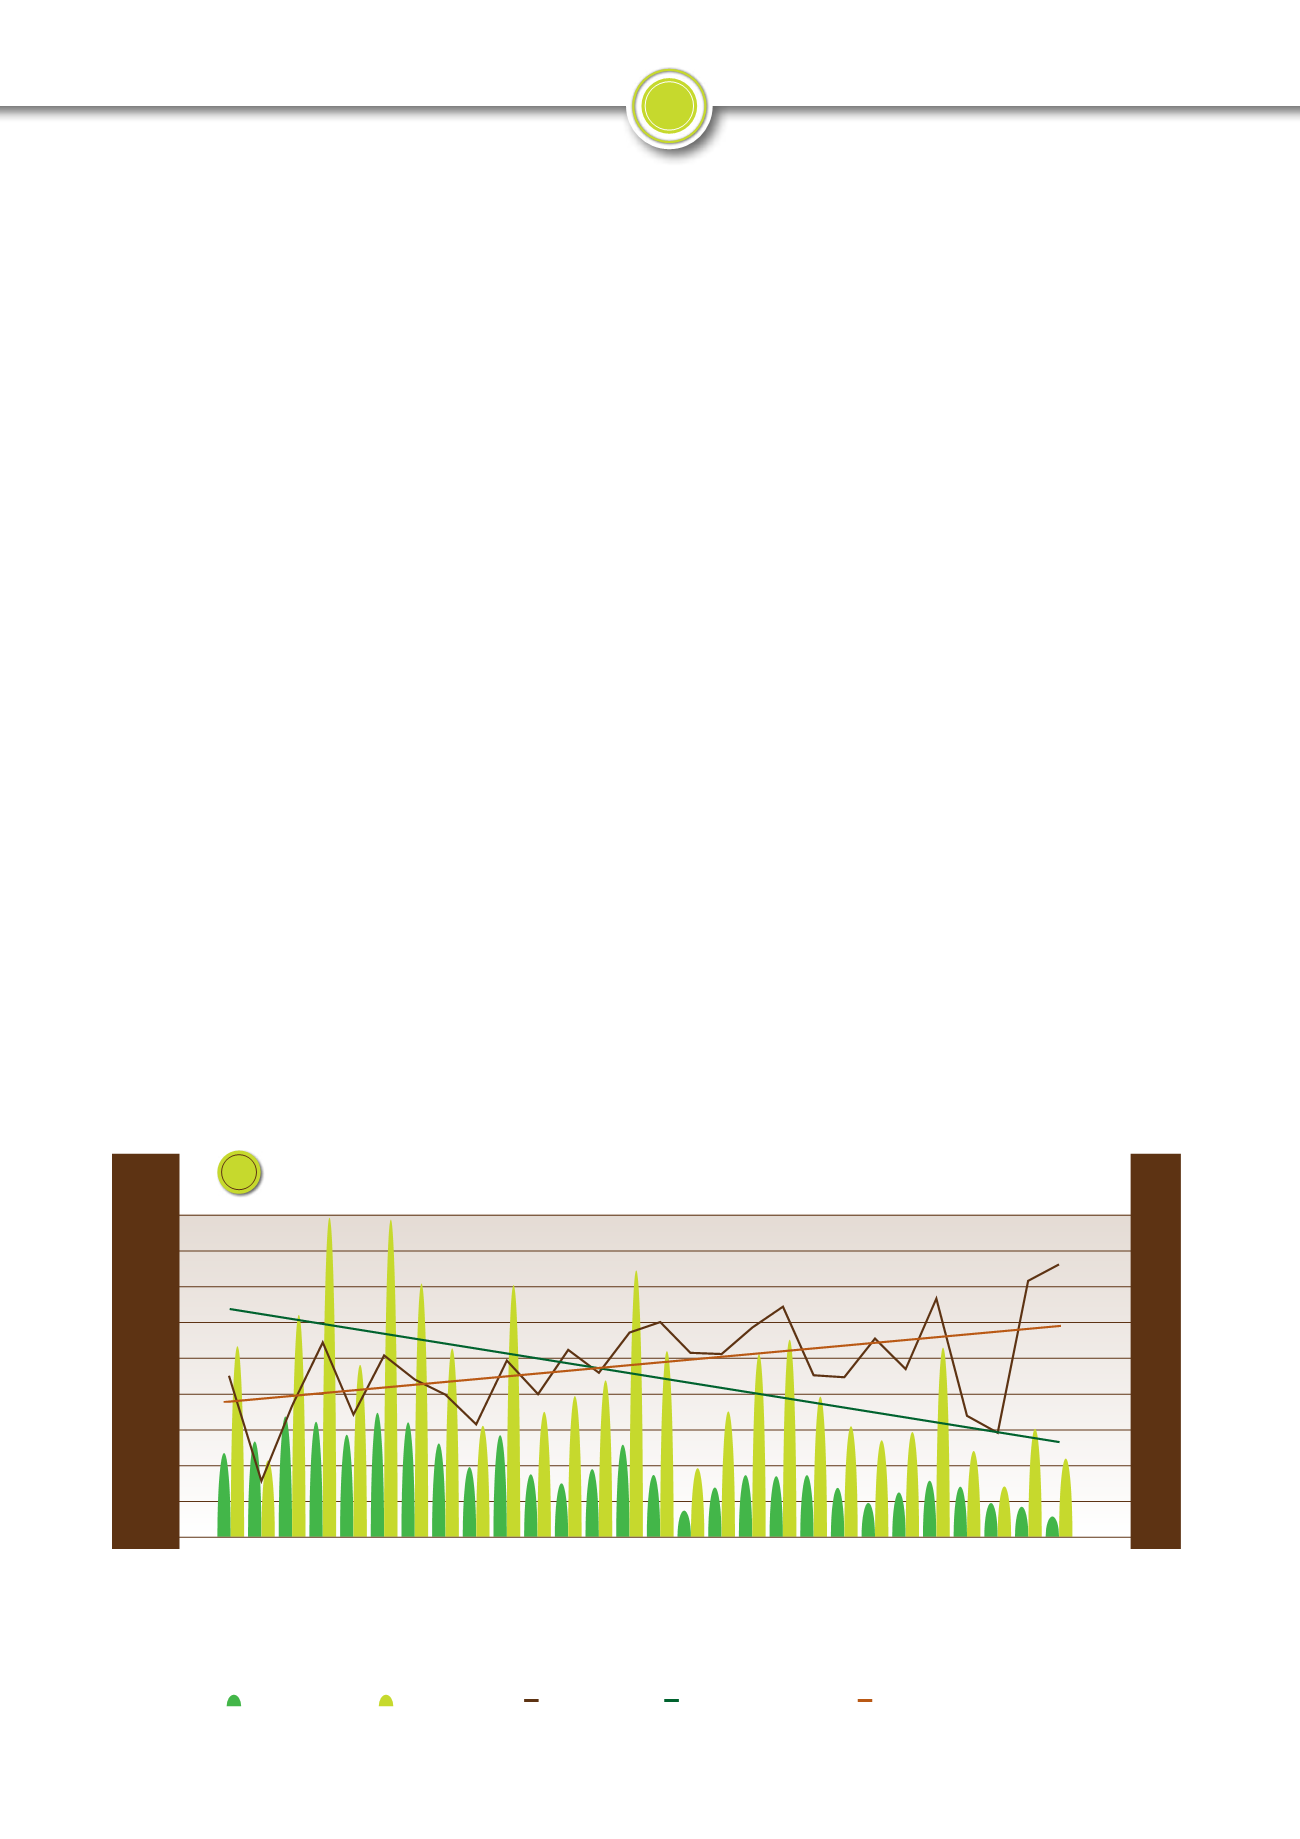
Sorghum
Grafiek 4
toon die sorghumoppervlakte aangeplant, die produksie en
gemiddelde opbrengs sedert die 1990/1991-seisoen. Dit is duidelik dat die
sorghumproduksie oor hierdie tydperk ’n afwaartse tendens getoon het,
terwyl die opbrengste ’n stygende tendens getoon het. Die sorghumop-
pervlakte van 28 800 ha, wat gedurende die 2017/2018-seisoen aange-
plant is, is die kleinste oppervlakte nóg wat sedert die 1990/1991-seisoen
aangeplant is. Die produksie vir die seisoen was egter nie onbevredigend
nie. Die Nasionale Oesskattingskomitee (NOK) se finale produksieskat-
ting vir die 2017/2018-seisoen word op 109 900 ton geskat. Alhoewel dit
ongeveer 28% minder is as die vorige seisoen se skatting, is die gemid-
delde opbrengs vir die seisoen ongeveer 6% hoër as die vorige seisoen
se opbrengs. Die gemiddelde opbrengs van 3,81 t/ha is ’n nuwe Suid-
Afrikaanse rekordopbrengs vir sorghum. Dit is hoër as die vorige seisoen
se rekord gemiddelde opbrengs van 3,58 t/ha en ook aansienlik hoër as
die langtermyngemiddelde opbrengs van 2,68 t/ha.
Sonneblomsaad
Die sonneblomsaad-oppervlakte van 601 500 hektaar wat gedu
rende die 2017/2018-produksieseisoen aangeplant is, is ongeveer 5,4%
kleiner as wat die vorige seisoen se aanplantings was. Die sonneblom
saad-aanplantings het in die westelike gedeeltes van die land, as
gevolg van die reën wat laat was, in hierdie gedeeltes besonder laat
plaasgevind. Dit het die mark aanvanklik bitter skepties gelaat in terme
van opbrengsverwagtinge. Die sonneblomsaadproduksie vir die seisoen
het op die ou einde redelik goed herstel en volgens die NOK se finale
produksieskatting vir die 2017/2018-seisoen staan die sonneblomsaad-
produksie op 858 605 ton. Dit is ongeveer 2% laer as die vorige seisoen
se produksie. Die gemiddelde opbrengs van 1,43 t/ha vir die seisoen
is ongeveer 3,8% hoër as die vorige seisoen se opbrengs, terwyl die
langtermyngemiddelde opbrengs ongeveer 1,25 t/ha is.
Grafiek 5
(op bladsy 82) toon sonneblomsaad se oppervlakte aangeplant,
produksie asook die gemiddelde opbrengste vanaf die 1990/1991-sei-
soen tot en met die 2017/2018-seisoen.
Grondbone
Grafiek 6
(op bladsy 83) toon die oppervlakte aangeplant, produksie
en gemiddelde opbrengs van grondbone in Suid-Afrika sedert die
4,5
4
3,5
3
2,5
2
1,5
1
0,5
0
t/ha
Sorghum area planted and production
Sorghumoppervlakte geplant en produksie
* Preliminary/Voorlopig
1990/1991
1991/1992
1992/1993
1993/1994
1994/1995
1995/1996
1996/1997
1997/1998
1998/1999
1999/2000
2000/2001
2001/2002
2002/2003
2003/2004
2004/2005
2005/2006
2006/2007
2007/2008
2008/2009
2009/2010
2010/2011
2011/2012
2012/2013
2013/2014
2014/2015
2015/2016
2016/2017
2017/2018*
Area
Oppervlakte
Production
Produksie
Yield
Opbrengs
Linear (Production)
Linieêr (Produksie)
Linear (Yield)
Linieêr (Opbrengs)
4
Sorghum
Graph 4
shows the sorghum area planted, the production and
average yield since the 1990/1991 season. It is clear that sorghum
production showed a downward trend over this period, while the
yield showed an upward trend. The sorghum area of 28 800 ha
planted during the 2017/2018 season was the smallest area yet
planted since the 1990/1991 season. However, the production for
the season was not unsatisfactory. The final production estimate for
the 2017/2018 season by the National Crop Estimates Committee
(CEC) stood at 109 900 tons. Although it is roughly 28% less than
that for the previous season, the average yield for the season was
about 6% higher than for the previous season. The average yield
of 3,81 t/ha is a new South African record yield for sorghum. It is
higher than the previous season’s record yield of 3,58 t/ha and also
considerably higher than the long-term average yield of 2,68 t/ha.
Sunflower seed
The sunflower seed area of 601 500 hectares that was planted
during the 2017/2018 production season was approximately 5,4%
smaller than that for the previous season. The sunflower seed
plantings in the western parts of the country occurred particularly
late because of the late rain in those areas. This left the market
very sceptical initially in terms of yield expectations. The sunflower
seed production for this season eventually recovered quite well, and
according to the CEC’s final production estimate for the 2017/2018
season the sunflower seed production stood at 858 605 tons. This
was approximately 2% lower than the previous season’s production.
The average yield of 1,43 t/ha for the season was approximately
3,8% higher than that for the previous season, while the long-term
average yield was approximately 1,25 t/ha.
Graph 5
(on page 82)
shows the area planted with sunflower seed, production and the average
yield from the 1990/1991 season up to the 2017/2018 season.
Groundnuts
Graph 6
(on page 83) shows the area planted, production and
the average yield of groundnuts in South Africa since the 2000/2001
season. It is clear that the plantings as well as the production
Production years
●
Produksiejare
’000 ton
or/of ha
450
400
350
300
250
200
150
100
50
0