


 82 / 143

80
Jaarverslag 2018
annual report 2018
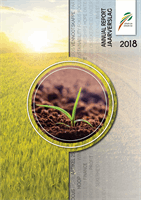
Grafiek 2
dui die aanplantings van wit- en geelmielies vanaf die
1990/1991-seisoen tot en met 2017/2018-seisoen as ’n persentasie
aan. In die 2017/2018-produksieseisoen het die witmielie-aanplantings
ongeveer 55% tot die totale oppervlakte onder mielies aangeplant
bygedra, terwyl die aanplantings van geelmielies 45% van die totale
hektare beslaan het. In die vorige seisoen het witmielie-aanplantings
ongeveer 63% van die totale oppervlakte beslaan, terwyl geelmielies
37% van die totale oppervlakte beslaan het.
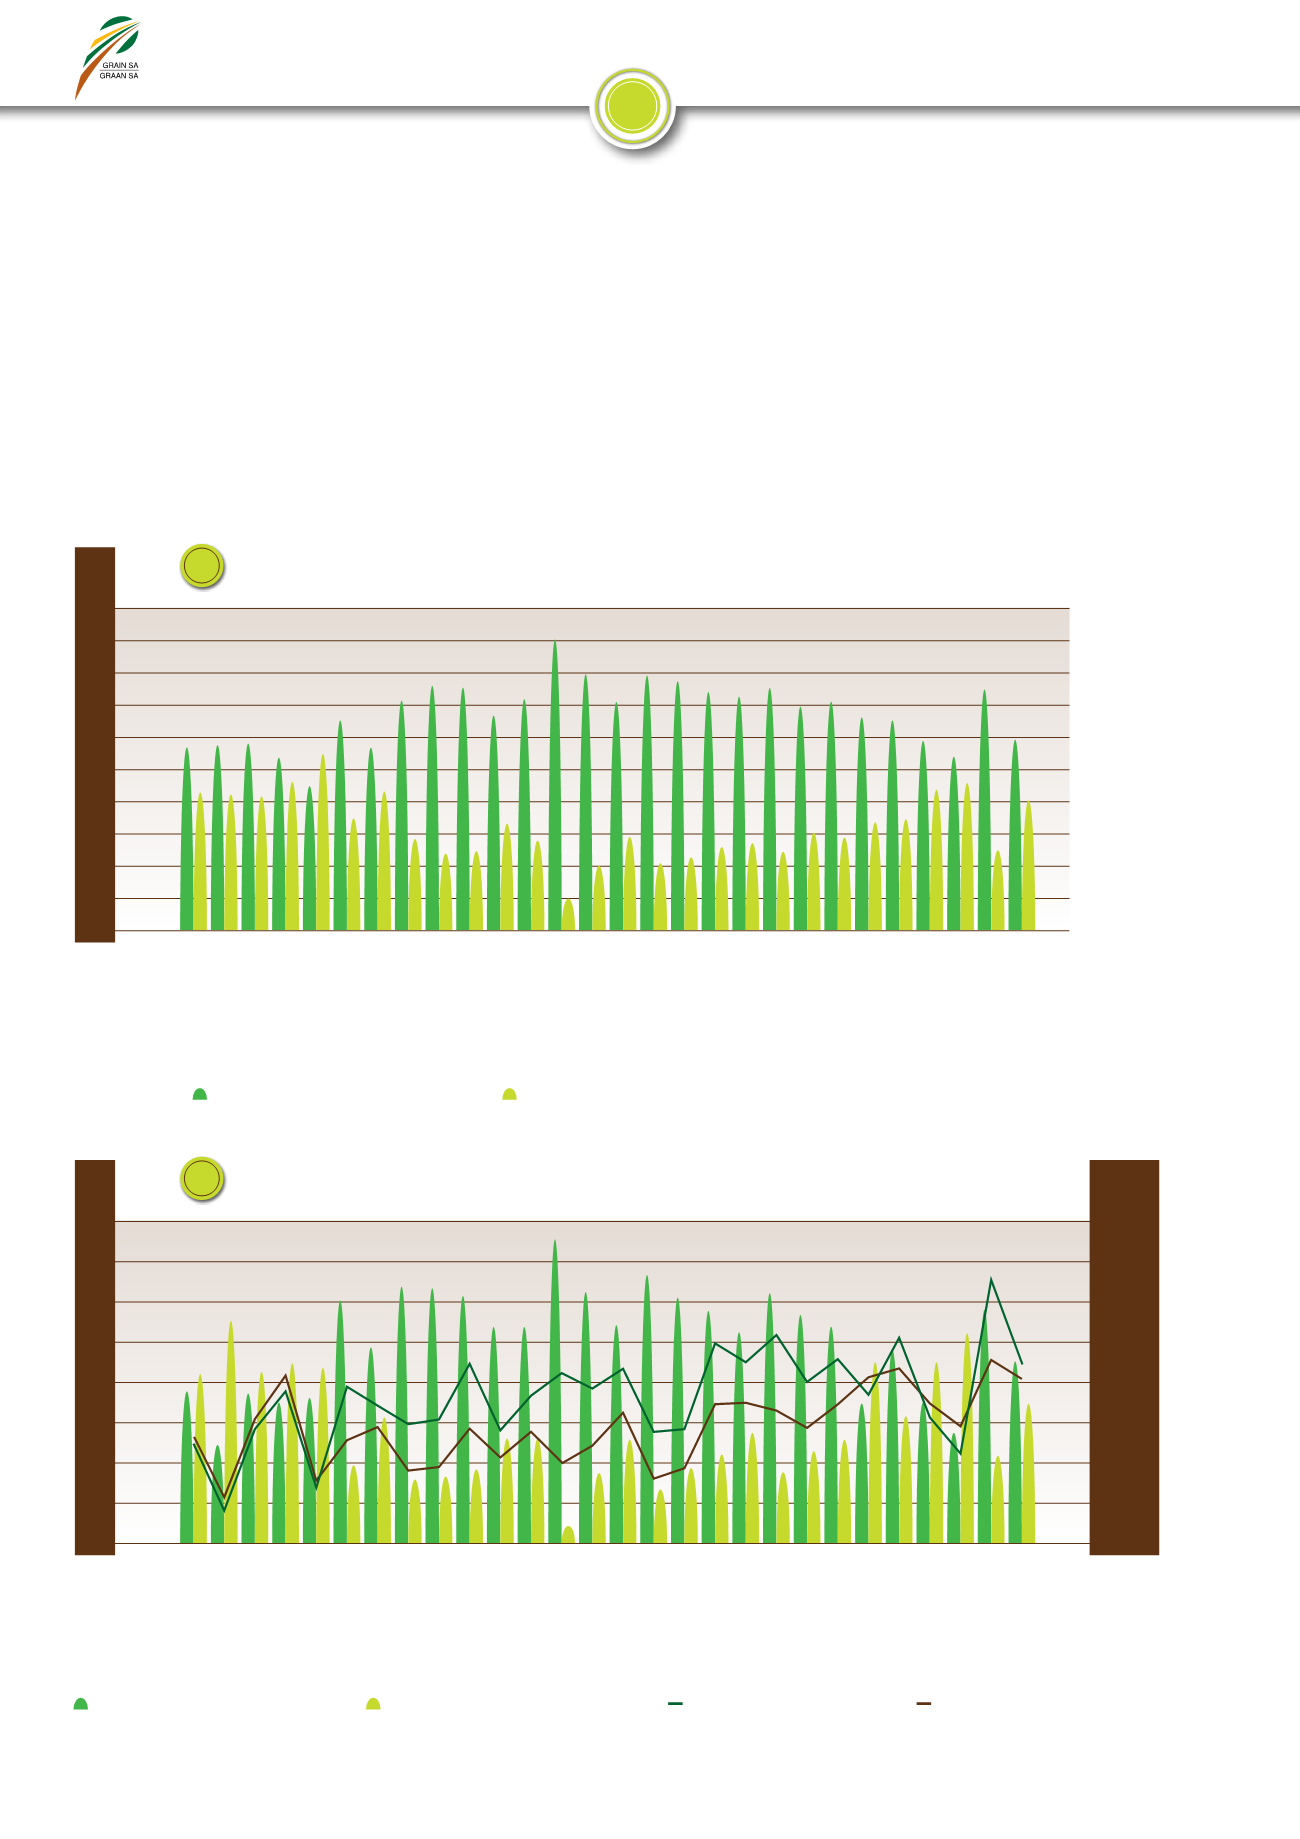
Grafiek 3
toon die totale
produksie van wit- en geelmielies, asook die verhouding tussen
die wit- en geelmielieproduksie vanaf die 1990/1991-seisoen tot en
met die 2017/2018-seisoen. Dit is duidelik dat die verhouding van
produksie tussen wit en geelmielies in die 2017/2018-seisoen weer
baie nader aan mekaar beweeg het, terwyl die vorige seisoen se
witmielieproduksie aansienlik hoër was.
%
Percentage plantings of white and yellow maize
Persentasie aanplantings van wit- en geelmielies
* Preliminary/Voorlopig
1990/1991
1991/1992
1992/1993
1993/1994
1994/1995
1995/1996
1996/1997
1997/1998
1998/1999
1999/2000
2000/2001
2001/2002
2002/2003
2003/2004
2004/2005
2005/2006
2006/2007
2007/2008
2008/2009
2009/2010
2010/2011
2011/2012
2012/2013
2013/2014
2014/2015
2015/2016
2016/2017
2017/2018*
White maize as % of total plantings
Witmielies as % van totale aanplantings
Yellow maize as % of total plantings
Geelmielies as % van totale aanplantings
2
70
65
60
55
50
45
40
35
30
12 000
10 00
8 000
6 000
4 000
2 000
0
%
’000 ton
Production of white and yellow maize
Produksie van wit- en geelmielies
* Preliminary/Voorlopig
1990/1991
1991/1992
1992/1993
1993/1994
1994/1995
1995/1996
1996/1997
1997/1998
1998/1999
1999/2000
2000/2001
2001/2002
2002/2003
2003/2004
2004/2005
2005/2006
2006/2007
2007/2008
2008/2009
2009/2010
2010/2011
2011/2012
2012/2013
2013/2014
2014/2015
2015/2016
2016/2017
2017/2018*
White maize as % of total production
Witmielies as % van totale produksie
Yellow maize as % of total production
Geelmielies as % van totale produksie
White maize production (ton)
Witmielieproduksie (ton)
Yellow maize production (ton)
Geelmielieproduksie (ton)
3
Graph 2
indicates the plantings of white and yellow maize from
the 1990/1991 season until the 2017/2018 season as a percentage.
In the 2017/2018 production season the white maize plantings
contributed approximately 55% to the total area planted under
maize, while the plantings of yellow maize covered 45% of the total
hectares. In the previous season, white maize plantings contributed
approximately 63% to the total area, while yellow maize accounted
for 37% of the total area.
Graph 3
shows the total production of white
and yellow maize, as well as the ratio between the white and yellow
maize production from the 1990/1991 season up to the 2017/2018
season. It is clear that the ratio of production between white and
yellow maize in the 2017/2018 season moved much closer to each
other again, while the previous season’s white maize production was
considerably higher.
Production years
●
Produksiejare
Production years
●
Produksiejare
75
70
65
60
55
50
45
40
35
30
25