


 85 / 143

83
Markoorsig vir die 2017/2018-produksieseisoen
Market overview for the 2017/2018 production season
68 525 ton toegeneem. Die gemiddelde opbrengs vir die seisoen was
ongeveer 1,3 t/ha, wat heelwat laer as die vorige seisoen se gemiddelde
opbrengs van 1,52 t/ha is. Die opbrengs vir die seisoen was wel hoër
as die langtermyngemiddeld van 1,2 t/ha.
Grafiek 8
(op bladsy 84)
toon die oppervlakte aangeplant, die produksie asook die gemiddelde
opbrengste vanaf 1990/1991 tot en met die 2017/2018-seisoen vir
droëbone in Suid-Afrika.
Koring
Die 2017/2018-seisoen was ’n uiters uitdagende seisoen vir koring-
produksie – met die omgewingstoestande wat veral in die Wes-Kaap
uiters ongunstig was. Die grootste gedeelte van die produksieseisoen
was also considerably lower than the previous season’s average yield
of 1,52 t/ha. The yield for the season was higher than the long-term
average of 1,2 tons/ha, however.
Graph 8
(on page 84) shows the
area planted, production and the average yield for dry beans in South
Africa from the 1990/1991 up to the 2017/2018 season.
Wheat
The 2017/2018 season was an extremely challenging one for
wheat production, with the environmental conditions in the Western
Cape in particular being extremely unfavourable. The biggest part
of the production season was dominated by drought conditions.
This led to a considerable decrease in the local wheat production.
2
1,8
1,6
1,4
1,2
1
0,8
0,6
0,4
0,2
0
t/ha
’000 ton
or/of ha
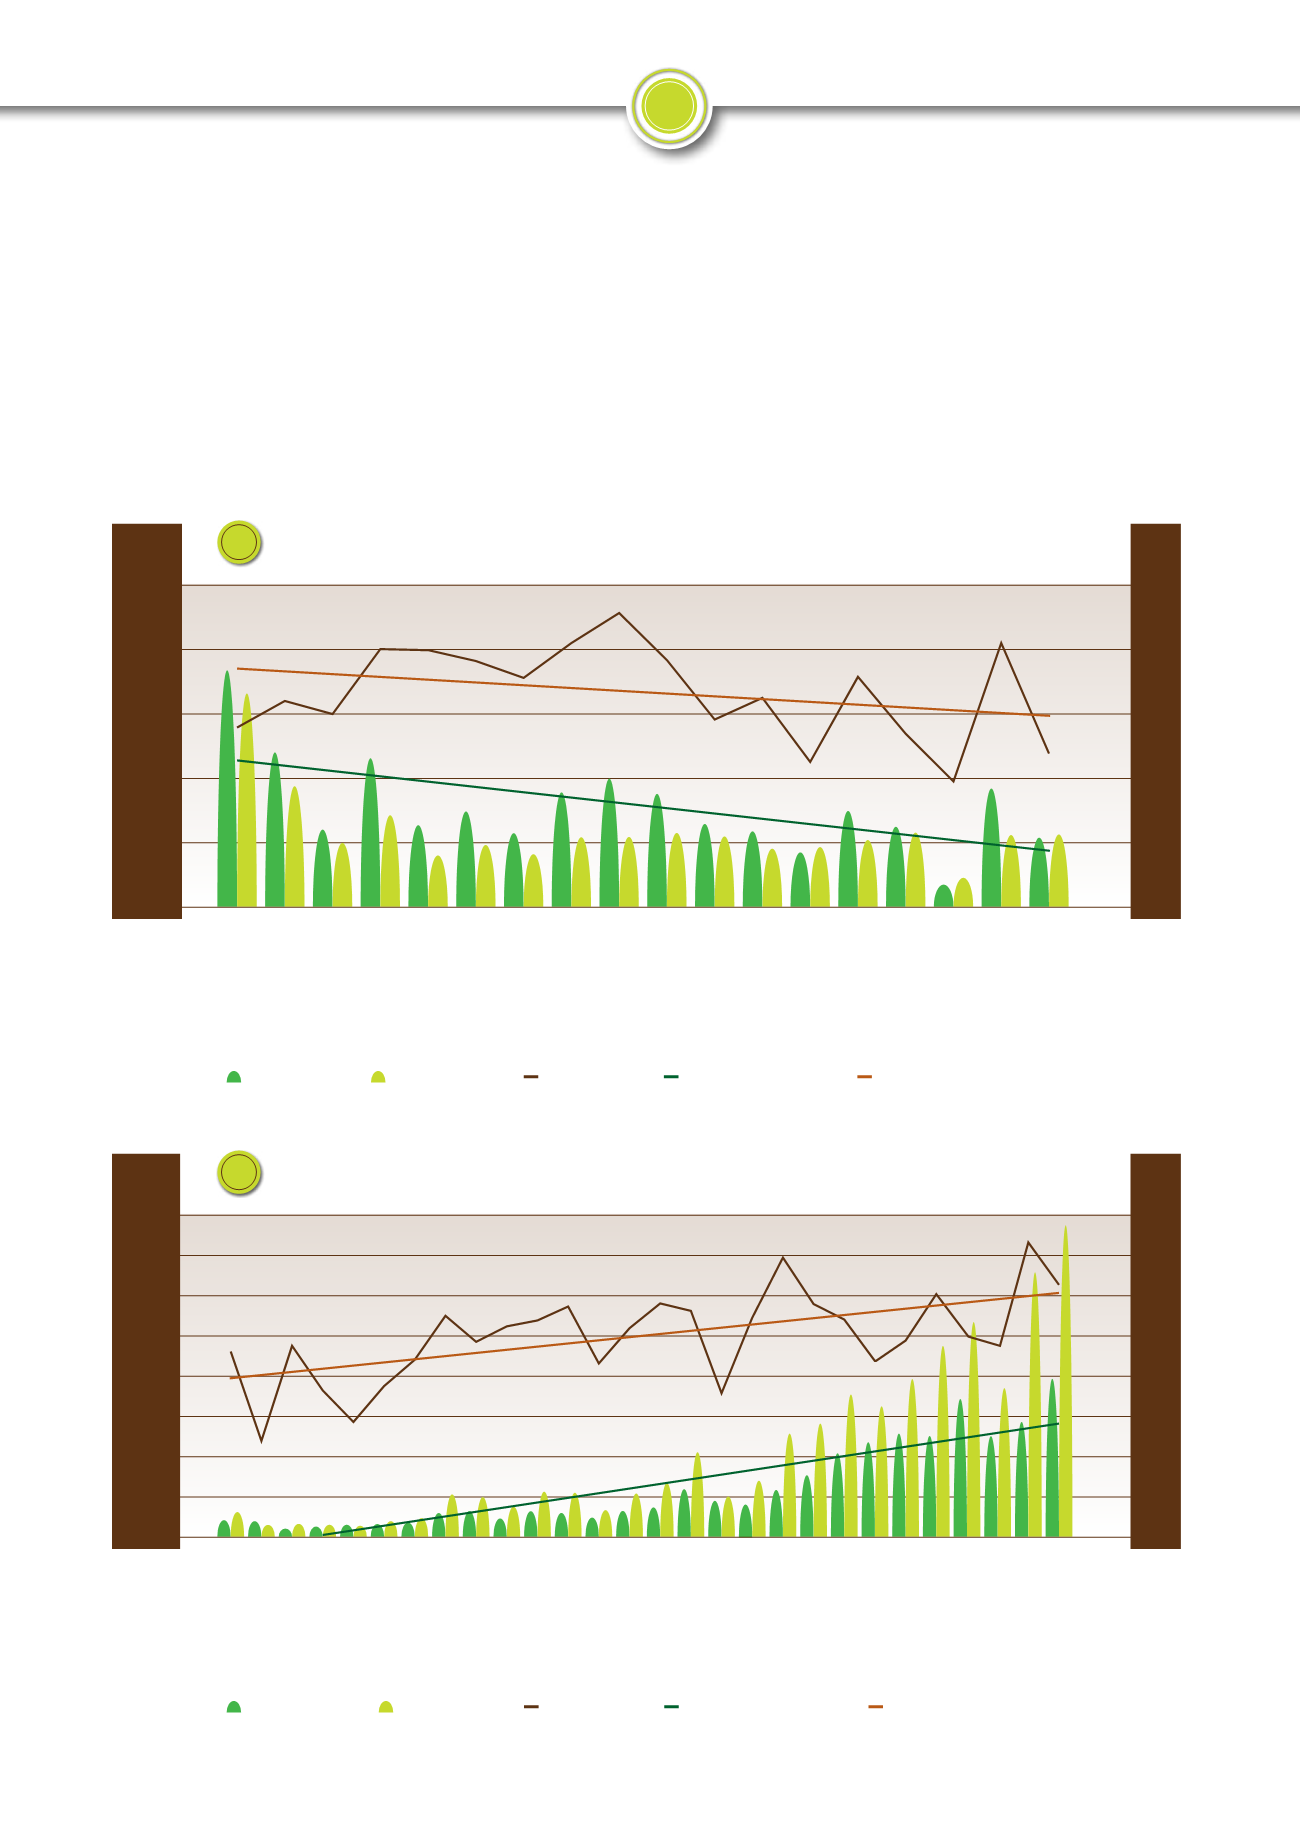
Groundnuts area planted and production
Grondboonoppervlakte geplant en produksie
* Preliminary/Voorlopig
2000/2001
2001/2002
2002/2003
2003/2004
2004/2005
2005/2006
2006/2007
2007/2008
2008/2009
2009/2010
2010/2011
2011/2012
2012/2013
2013/2014
2014/2015
2015/2016
2016/2017
2017/2018*
Production
Produksie
Area
Oppervlakte
Yield
Opbrengs
Linear (Production)
Linieêr (Produksie)
Linear (Yield)
Linieêr (Opbrengs)
6
2,5
2
1,5
1
0,5
0
t/ha
Soybeans area planted and production
Sojaboonoppervlakte geplant en produksie
* Preliminary/Voorlopig
1990/1991
1991/1992
1992/1993
1993/1994
1994/1995
1995/1996
1996/1997
1997/1998
1998/1999
1999/2000
2000/2001
2001/2002
2002/2003
2003/2004
2004/2005
2005/2006
2006/2007
2007/2008
2008/2009
2009/2010
2010/2011
2011/2012
2012/2013
2013/2014
2014/2015
2015/2016
2016/2017
2017/2018*
Area
Oppervlakte
Production
Produksie
Yield
Opbrengs
Linear (Area)
Linieêr (Oppervlakte)
Linear (Yield)
Linieêr (Opbrengs)
7
’000 ton
or/of ha
Production years
●
Produksiejare
Production years
●
Produksiejare
250
200
150
100
50
0
1 600
1 400
1 200
1 000
800
600
400
200
0