


 81 / 116

79
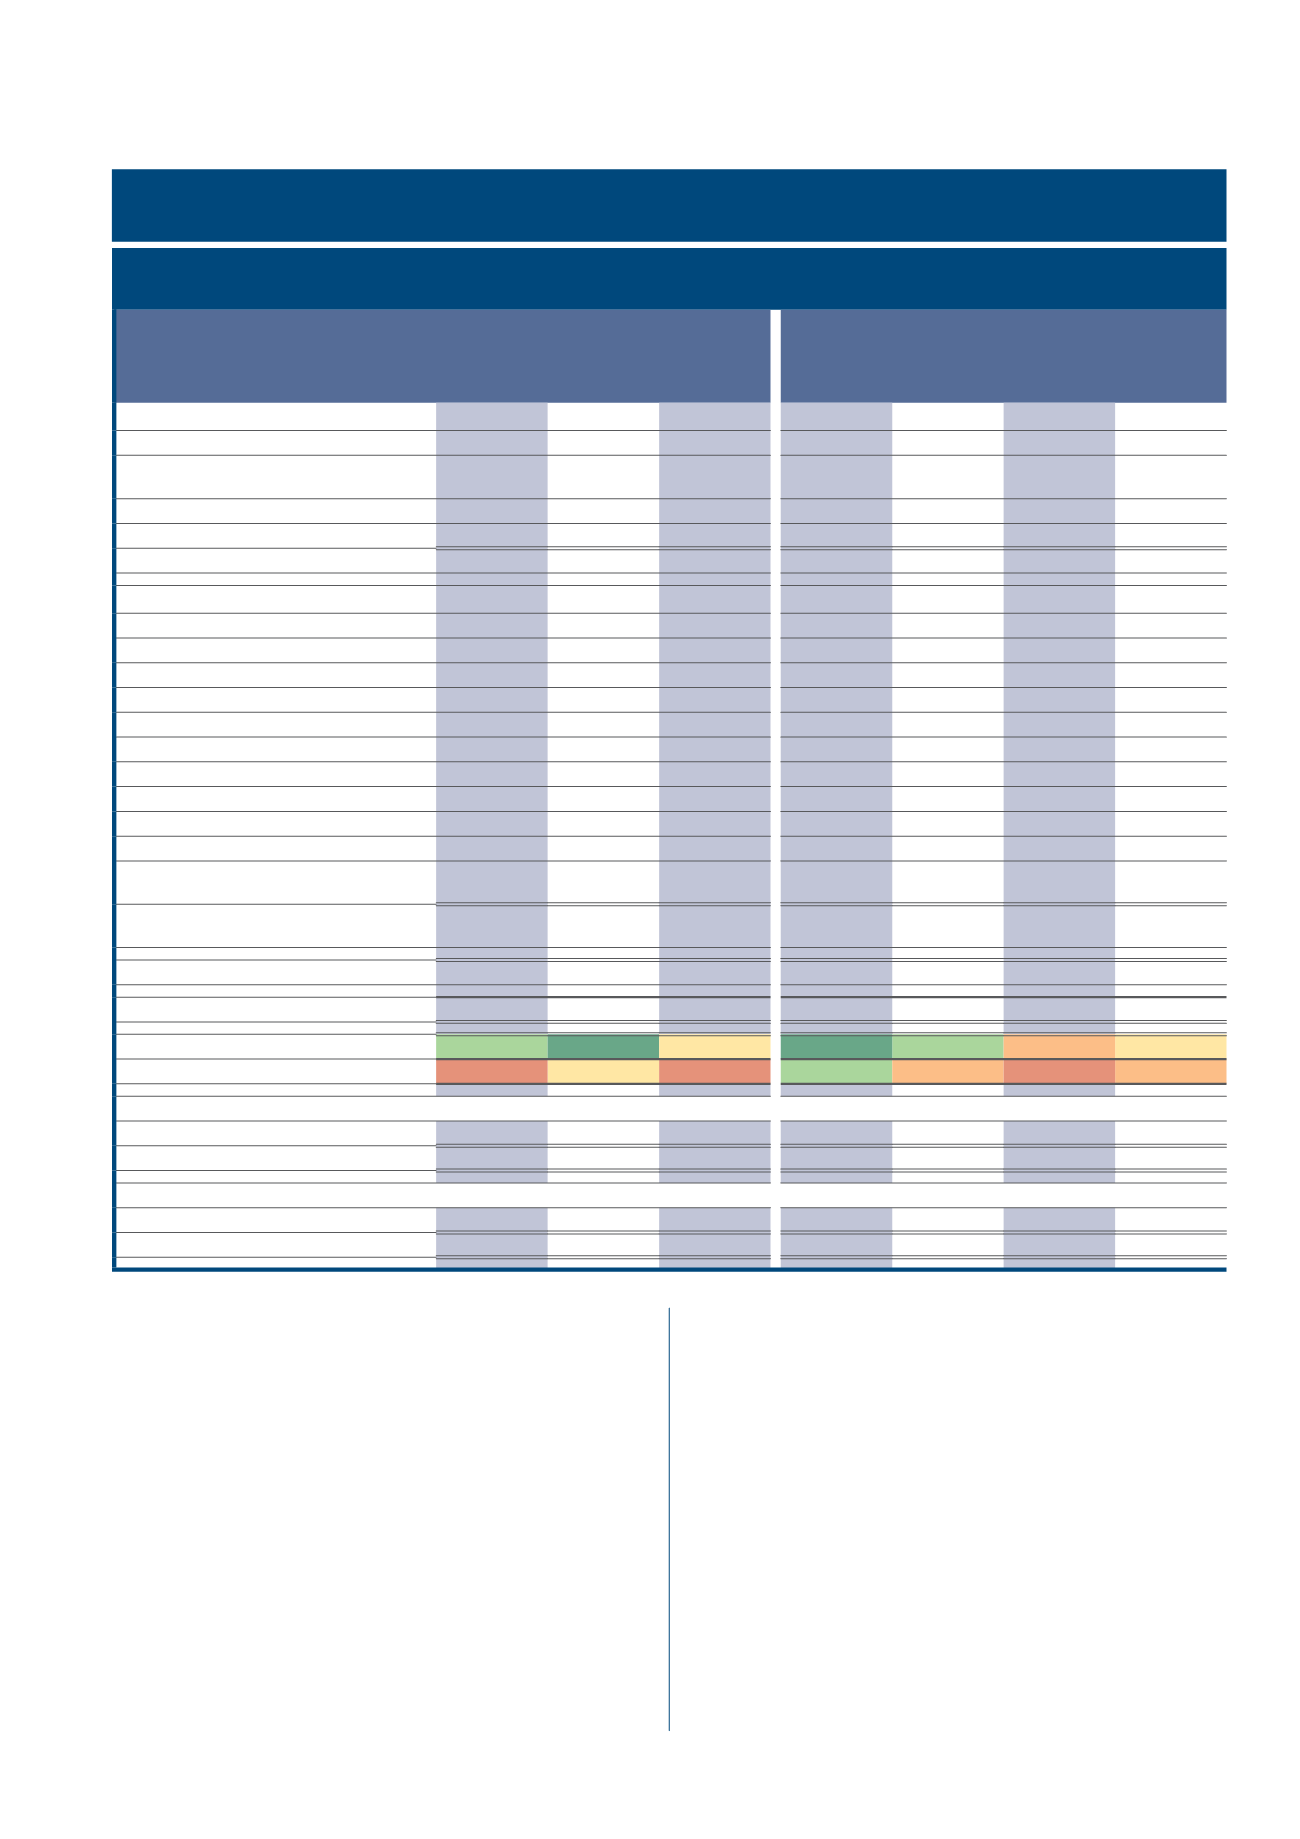
TABLE 7 – Comparison of production cost budgets for summer grain for the 2019/2020 season (western region).
TABEL 7 – Vergelyking van produksiekostebegrotings vir somergraan vir die 2019/2020-seisoen (westelike streke).
NORTH WEST PROVINCE
NOORDWES PROVINSIE
NORTH WEST CENTRAL FREE STATE
NOORDWES-SENTRAAL-VRYSTAAT
Maize
Mielies
Sunflower
Sonneblom
Soybeans
Sojabone
Maize
(higher yield)
Mielies (hoër
opbrengs)
Maize
Mielies
Sunflower
Sonneblom
Soybeans
Sojabone
1. Income/Inkomste
Planned yield/Beplande opbrengs (t/ha)
3,50
1,50
1,25
6,50
4,50
1,50
1,75
Safex price (best grade)/Safex-prys
(beste graad) (R/ton)
R2 700
R5 120
R5 300
R2 700
R2 700
R5 120
R5 300
Deductions/Aftrekkings (R/ton)
R260
R295
R128
R280
R280
R323
R128
Producer price/Produsenteprys (R/ton)
R2 440
R4 825
R5 172
R2 420
R2 420
R4 797
R5 172
Gross income/Bruto inkomste (R/ha)
R8 540
R7 238
R6 465
R15 730
R10 890
R7 196
R9 051
2. Variable costs/Veranderlike kostes
Seed/Saad
R968
R462
R695
R1 252
R1 129
R528
R773
Fertiliser/Kunsmis
R1 756
R1 016
R1 259
R2 957
R2 047
R1 256
R1 071
Lime/Kalk
R167
R167
R167
R147
R147
R147
R 47
Fuel/Brandstof
R1 092
R916
R858
R1 020
R1 064
R1 078
R1 058
Repairs/Reparasie
R662
R730
R626
R679
R666
R613
R685
Herbicides/Onkruiddoders
R837
R181
R582
R796
R682
R474
R407
Pesticides/Plaagdoder
R305
R26
R122
R192
R108
R219
R475
Input insurance/Insetversekering
R384
R141
R128
R307
R212
R164
R179
Grain price hedging/Graanprysverskansing
R518
R199
R244
R644
R527
R239
R268
Crop insurance/Oesversekering
R152
R203
R674
R439
R319
R324
R825
Production credit interest/
Produksiekrediet-rente
R376
R222
R294
R464
R380
R266
R324
Total variable costs/Totale veranderlike
koste (R/ha)
R7 218
R4 263
R5 649
R8 896
R7 282
R5 307
R6 212
Total fixed costs/Totale vaste koste (R/ha)
R2 611
R2 355
R2 407
R2 572
R2 457
R2 356
R2 179
Total costs/Totale koste (R/ha)
R9 828
R6 618
R8 056
R11 468
R9 739
R7 664
R8 391
3. Gross margin/Bruto marge (R/ha)
R1 322
R2 974
R816
R6 834
R3 608
R1 888
R2 839
4. Net margin/Netto marge (R/ha)
-R1 288
R619
-R1 591
R4 262
R1 151
-R468
R660
Breakeven (variable costs only)/Gelykbreek (slegs veranderlike koste)
Yield/Opbrengs (t/ha)
2,96
0,88
1,09
3,68
3,01
1,11
1,20
Safex price/Safex-prys (R/ha)
2 322
3 137
4 647
1 649
1 898
3 861
3 678
Breakeven (variable + fixed cost)/Gelykbreek (veranderlike + vaste koste)
Yield/Opbrengs (t/ha)
4,03
1,37
1,56
4,74
4,02
1,60
1,62
Safex price/Safex-prys (R/ha)
3 068
4 707
6 573
2 044
2 444
5 432
4 923
assumptions for production conditions in different regions. These tables
are compiled to show an indication of the difference in profitability
between the various summer crops, but it is important to note that these
figures may vary from producer to producer.
WESTERN PARTS OF THE COUNTRY
The compiled maize budgets and their performance against other
crops are shown in
Table 7
. The yield scenarios were based on
assumptions for production conditions in the western parts of the
country (North West Province and North West Central Free State).
This figure is compiled to show an indication of the difference in
profitability between the various summer crops (maize, sunflower,
soybeans), but it is important to note that these figures may vary from
producer to producer.
While
Table 7
shows estimated production costs for the North West
Province and North West Central Free State,
Graph 18
again illustrates
the gross and net margin situation. Sunflower production was under
severe pressure this past season due to diseases that had a very
vir produksietoestande in verskillende streke gegrond. Hierdie tabelle word
saamgestel om ’n aanduiding te gee van die verskil in winsgewendheid
tussen die onderskeie somergewasse, maar dit is belangrik om daarop te
let dat hierdie syfers van produsent tot produsent kan verskil.
WESTELIKE DELE VAN DIE LAND
Die saamgestelde mieliebegrotings en hulle prestasie teenoor ander
gewasse word in
Tabel 7
getoon. Die opbrengsscenario’s is op aan-
names vir produksietoestande in die westelike dele van die land (Noord-
wes en die Noordwes-Sentraal-Vrystaat) gegrond. Hierdie figuur word
saamgestel om ’n aanduiding te gee van die verskil in winsgewendheid
tussen die onderskeie somergewasse (mielies, sonneblom, sojabone),
maar dit is belangrik om daarop te let dat hierdie syfers van produsent
tot produsent kan verskil.
Terwyl
Tabel 7
geraamde produksiekoste vir Noordwes en die Noord-
wes-Sentraal-Vrystaat toon, illustreer
Grafiek 18
die bruto en netto
margesituasie. Sonneblomproduksie was die afgelope seisoen onder
geweldige druk as gevolg van siektes wat ’n baie negatiewe impak op