


 80 / 116

78
popular way of comparing the relative profitability of grains within a
farm. This section provides a guideline in terms of the profitability of
maize versus sunflower and soybeans. The responsibility still lies with
each producer to do his/her own gross margin calculations because
production costs radically differ from neighbour to neighbour. This is
due to each grain producer's own unique system, the type of farming
unit and production practices.
Establishing production budgets prior to planting crops, is becoming
increasingly necessary and should not be taken lightly when making
production decisions. No one can accurately predict the future with
all its risks and uncertainties as it is about plans for the future and
is based on forecasts, historical data, assumptions and experience.
In light of this, producers, as budget users, should be aware that
budgets, as well as the assumptions on which they are based, are
constantly subject to change.
The cost structure of the budgets consists of variable and fixed costs.
If you do not make use of certain variable costs, one can deduct it from
the total variable costs. Although fixed costs vary dramatically from
producer to producer, an x-amount is provided to calculate an estimated
total production cost.
Forecasting the commodity price for the coming year is extremely
difficult. The Safex future contract price used in the calculations are
as follows:
Maize for delivery in July 2020 = R2 700/ton
Sunflower for delivery in May 2020 = R5 120/ton
Soybeans for delivery in May 2020 = R5 300/ton
The 2020 futures prices were determined by calculating the average
price since the beginning of trading for that particular contract month.
Based on the location differential, handling costs and marketing
commission, a producer price was calculated.
Maize prices are currently supported by relatively low local production
as well as an increase in international prices that support local prices.
It is important to note that the maize prices, which have been trading at
relatively higher levels in the past year, can motivate producers locally
to plant more maize. However, the greatest risk for the coming season
will be the weather conditions that will determine the plantings for the
season. If the weather conditions are fairly normal and the planting takes
place normally, there may again be a greater downward commodity
price risk in the coming season.
An illustration of the maize budgets and their performance against other
crops are shown in
Table 7
to
9
. The yield scenarios were based on
8 000
7 000
6 000
5 000
4 000
3 000
2 000
1 000
0
-1 000
-2 000
R
North West Province
Noordwes Provinsie
North West Central Free State
Noordwes-Sentraal-Vrystaat
Maize
Mielies
Maize
Mielies
Sunflower
Sonneblom
Sunflower
Sonneblom
Soybeans
Sojabone
Soybeans
Sojabone
Maize (higher yield)
Mielies (hoër opbrengs)
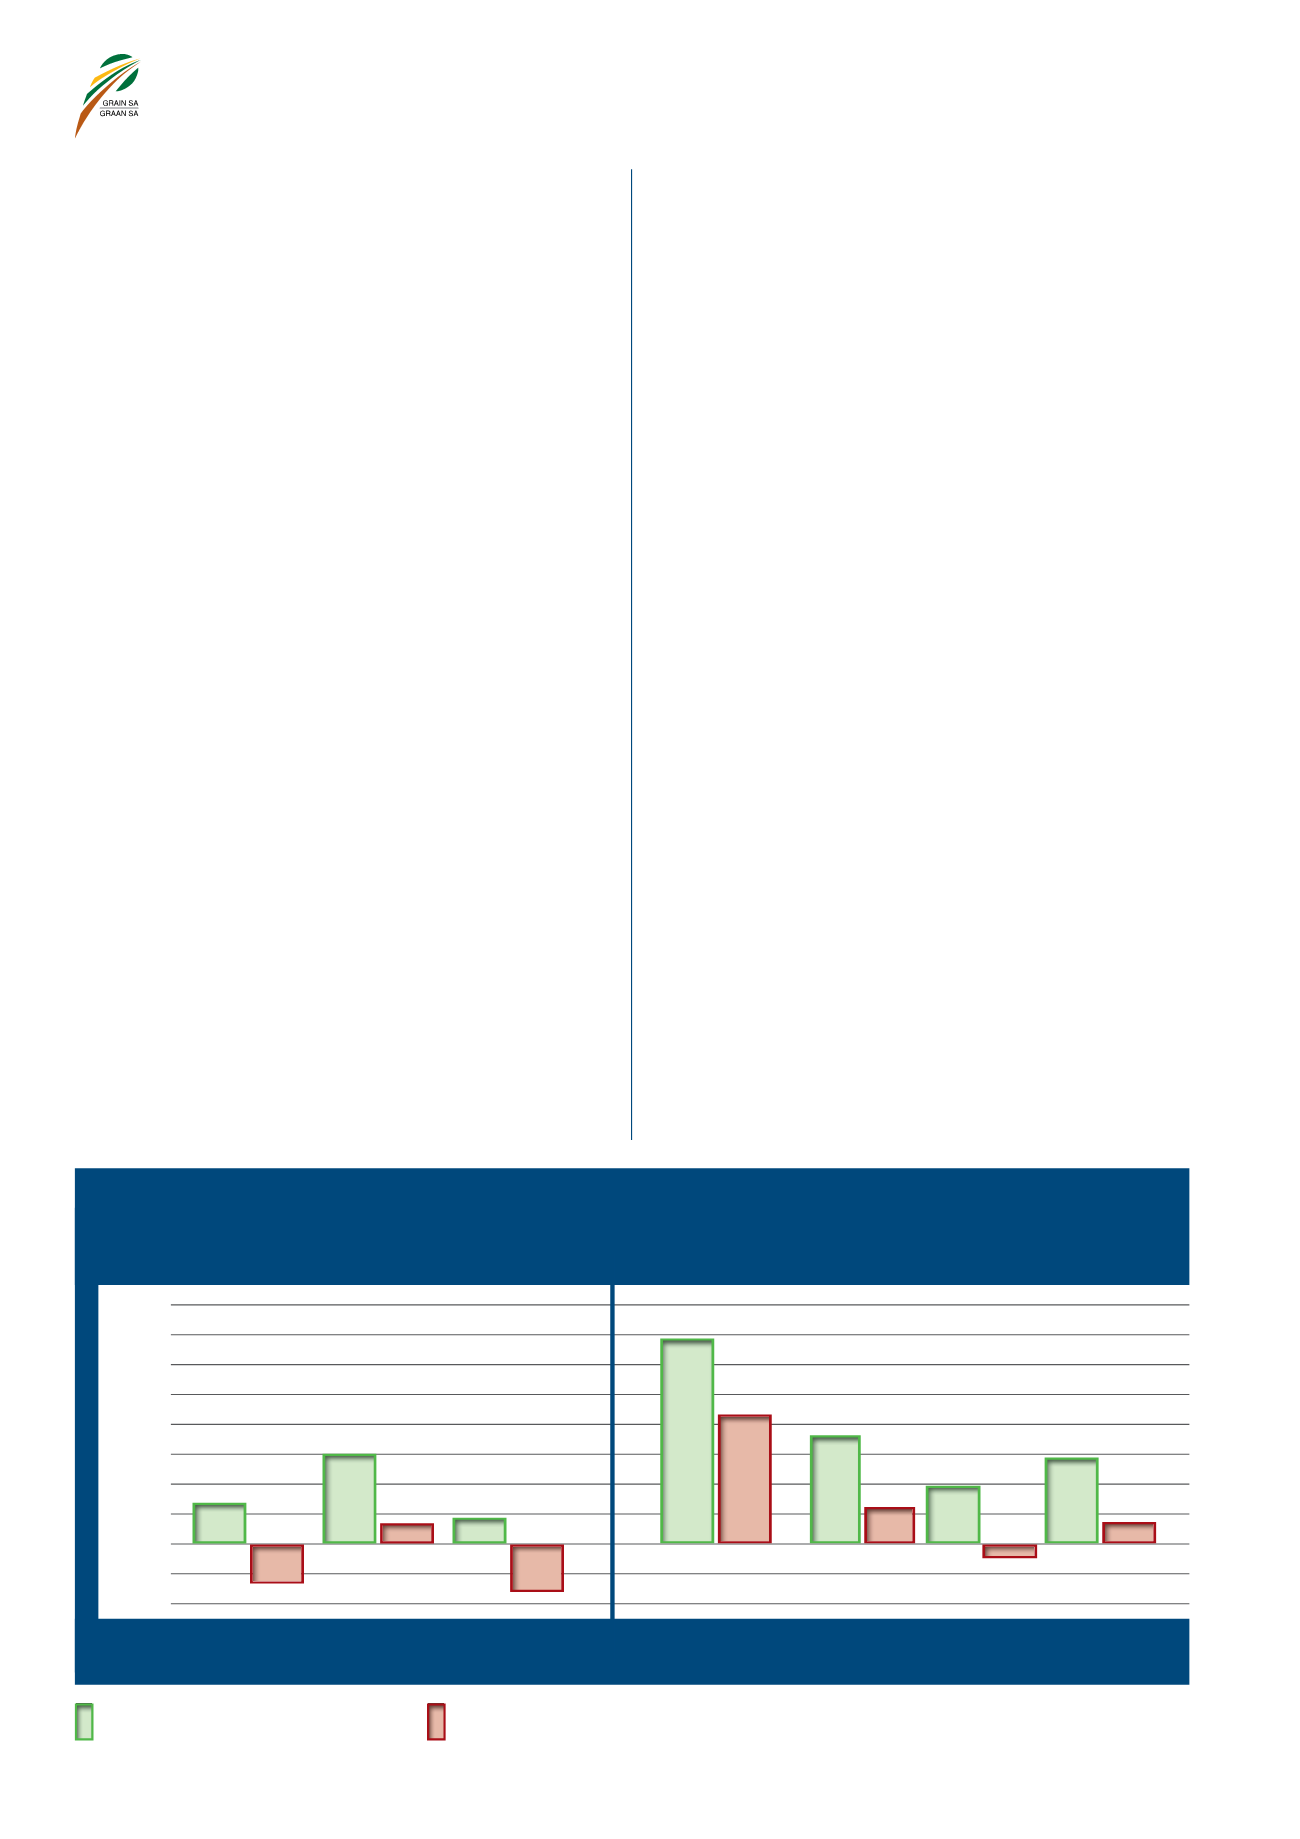
Net margins (total costs = variable + fixed costs)
Netto marge (totale kostes = veranderlike + vaste kostes)
Gross margins (variable costs only)
Bruto marge (slegs veranderlike kostes)
GRAPH 18 – Margin comparison for summer grain crops in the North West Province and North West
Central Free State for the 2019/2020 season.
GRAFIEK 18 – Margevergelyking vir somergraangewasse in Noordwes en die Noordwes-Sentraal-Vrystaat
vir die 2019/2020-seisoen.
en gewilde manier om die relatiewe winsgewendheid van graan op
’n plaas te vergelyk. Hierdie afdeling verskaf ’n riglyn ten opsigte van
die winsgewendheid van mielies teenoor sonneblom en sojabone. Die
verantwoordelikheid lê steeds by elke produsent om hulle eie bruto
marge te bereken, aangesien produksiekoste drasties van een buurman
tot die volgende een verskil. Dit is toe te skryf aan elke graanprodusent
se unieke stelsel, die tipe boerdery-eenheid en produksiepraktyke.
Dit word toenemend nodig om produksiebegrotings op te stel voordat
gewasse geplant word, en moenie ligtelik opgeneem word wanneer
produksiebesluite geneem word nie. Niemand kan die toekoms met
al sy risiko’s en onsekerhede akkuraat voorspel nie, aangesien dit
oor planne vir die toekoms gaan en op voorspellings, historiese data,
aannames en ervaring gegrond is. In die lig hiervan moet produsente
as die gebruikers van begrotings daarvan bewus wees dat begrotings,
sowel as die aannames waarop dit gegrond is, voortdurend verander.
Die kostestruktuur van die begroting bestaan uit veranderlike en vaste
koste. As sekere veranderlike koste nie gebruik word nie, kan dit van die
totale veranderlike koste afgetrek word. Hoewel vaste koste dramaties
van een produsent tot die volgende verskil, word ’n x-bedrag verskaf om
’n geraamde totale produksiekoste te bereken.
Dit is uiters moeilik om die kommoditeitsprys vir die komende jaar te
voorspel. Die Safex-termynkontrakprys wat in die berekenings gebruik
word, is soos volg:
Mielies vir lewering in Julie 2020 = R2 700/ton
Sonneblom vir lewering in Mei 2020 = R5 120/ton
Sojabone vir lewering in Mei 2020 = R5 300/ton
Die 2020-termynkontrakpryse is bepaal deur die gemiddelde prys sedert
die begin van verhandeling vir daardie spesifieke kontrakmaand te
bereken. ’n Produsenteprys is aan die hand van die liggingsdifferensiaal,
hanteringskoste en bemarkingskommissie bereken.
Mieliepryse word tans ondersteun deur relatief lae plaaslike produksie,
asook ’n styging in internasionale pryse, wat plaaslike pryse ondersteun.
Dit is belangrik om daarop te let dat die mieliepryse, wat die afgelope
jaar op relatief hoër vlakke verhandel, plaaslike produsente kan motiveer
om meer mielies aan te plant. Die grootste risiko vir die komende
seisoen sal egter die weerstoestande wees, wat die aanplantings vir die
seisoen sal bepaal. Indien die weerstoestande redelik normaal is en die
aanplanting normaal plaasvind, kan daar in die komende seisoen weer
’n groter afwaartse kommoditeitsprysrisiko inhou.
’n Illustrasie van die mieliebegrotings en hulle prestasie teen ander gewas-
se word in
Tabel 7
tot
9
getoon. Die opbrengsscenario’s is op aannames
R1 322
-R1 288
-R1 591
R2 974
R619
R816
R6 834
R4 262
R3 608
R1 151
R1 888
R2 839
R660
-R468