


 79 / 116

77
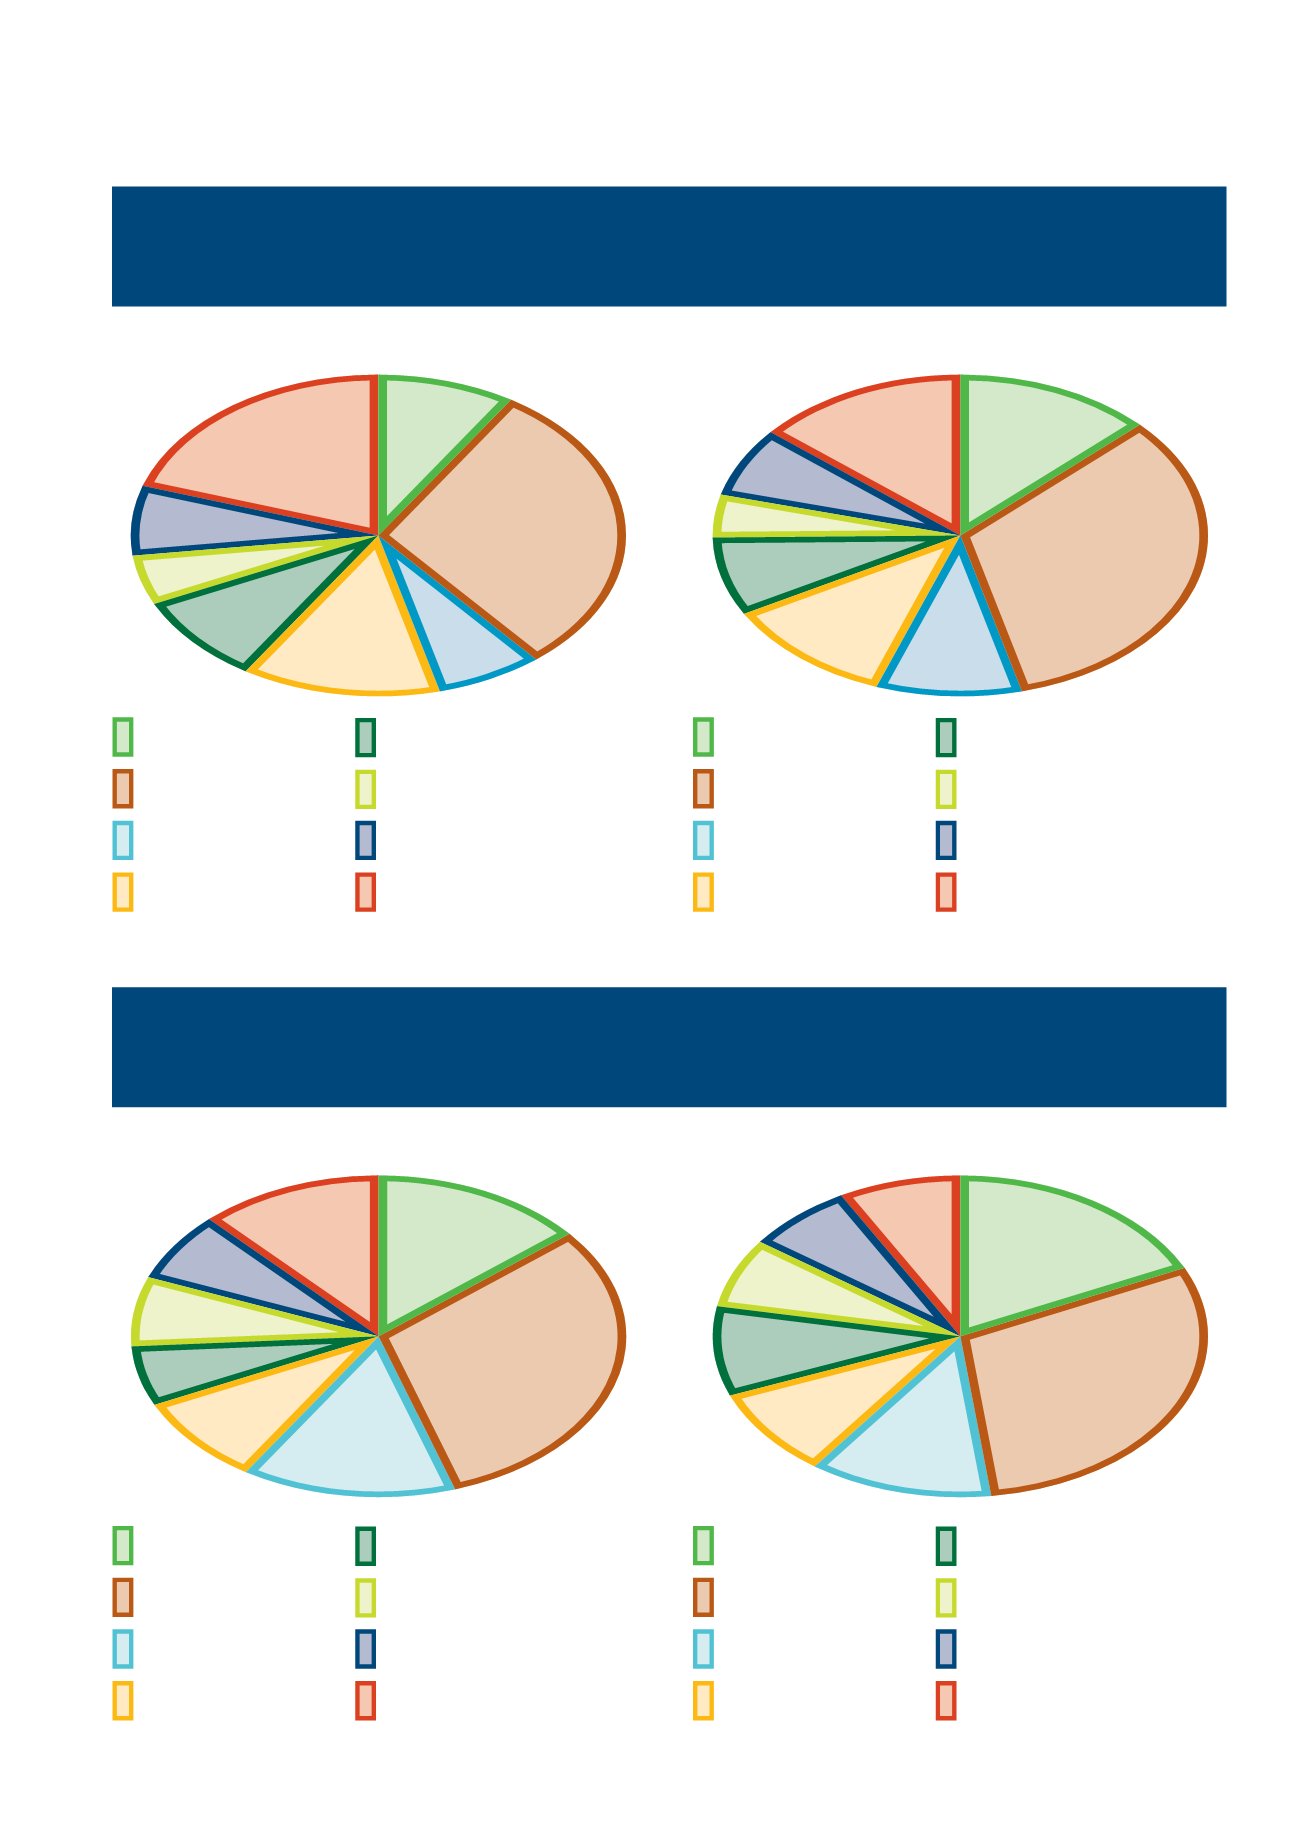
GRAPH 16 – Contribution of different variable input cost items to the total variable input cost of maize
for the North Western Free State.
GRAFIEK 16 – Bydrae van verskillende veranderlike-insetkoste-items tot die totale veranderlike insetkoste
van mielies in die Noordwes-Vrystaat.
Seed
Saad
9%
Seed
Saad
12,9%
Interest on production credit
Rente op produksiekrediet
7%
Interest on production credit
Rente op produksiekrediet
7%
7%
Chemical control
Chemiese beheer
9,5%
Chemical control
Chemiese beheer
9%
Repairs and parts
Herstel en onderdele
7,9%
Repairs and parts
Herstel en onderdele
30%
Fertiliser and lime
Kunsmis en kalk
33,2%
Fertiliser and lime
Kunsmis en kalk
20%
Other cost
Ander koste
13,9%
Other cost
Ander koste
13%
Fuel
Brandstof
11,4%
Fuel
Brandstof
5%
Permanent labour
Permanente arbeid
4,3%
Permanent labour
Permanente arbeid
30%
12,9%
33,2%
9,5%
11,4%
7,9%
4,3%
7%
13,9%
7%
13%
9%
5%
7%
20%
9%
2010/2011 Production season
2010/2011 Produksieseisoen
2017/2018 Production season
2017/2018 Produksieseisoen
GRAPH 17 – Contribution of different variable input cost items to the total variable input cost of maize
for KwaZulu-Natal.
GRAFIEK 17 – Bydrae van verskillende veranderlike-insetkoste-items tot die totale veranderlike insetkoste
van mielies in KwaZulu-Natal.
Seed
Saad
14%
Seed
Saad
18%
Interest on production credit
Rente op produksiekrediet
7%
Interest on production credit
Rente op produksiekrediet
7%
14%
Chemical control
Chemiese beheer
12%
Chemical control
Chemiese beheer
6%
Repairs and parts
Herstel en onderdele
9%
Repairs and parts
Herstel en onderdele
31%
Fertiliser and lime
Kunsmis en kalk
30%
Fertiliser and lime
Kunsmis en kalk
12%
Other cost
Ander koste
8%
Other cost
Ander koste
9%
Fuel
Brandstof
9%
Fuel
Brandstof
7%
Permanent labour
Permanente arbeid
7%
Permanent labour
Permanente arbeid
2010/2011 Production season
2010/2011 Produksieseisoen
2017/2018 Production season
2017/2018 Produksieseisoen
14%
31%
14%
9%
6%
7%
7%
12%
18%
30%
12%
9%
9%
7%
7%
8%