


 76 / 116

74
ANNUAL MEETING WITH SAAMA
In 2019, Grain SA again met with the South African Agricultural Machinery
Association (SAAMA) to discuss mutual challenges in the grain and oil-
seed industries. Important issues discussed were the following:
Market trends and production costs for the grain and oilseed industry.
Trends in the international and local agricultural machinery industry.
Logistics of agricultural machinery that cannot be licenced.
Import rebate on tractor tyres.
Precision support.
Diesel fuel quality.
Technology platforms.
Grey imports.
PRODUCTION COST OVERVIEW
Actual production cost
Grain SA collected/bought data and information during December
2018 and January 2019 to determine the major maize production
area’s actual income and production costs for the 2017/2018
production season. Determining and gathering the historic actual
income and production cost figures is important to the industry
as it identifies the actual figures paid for different items and the
profitability of a crop.
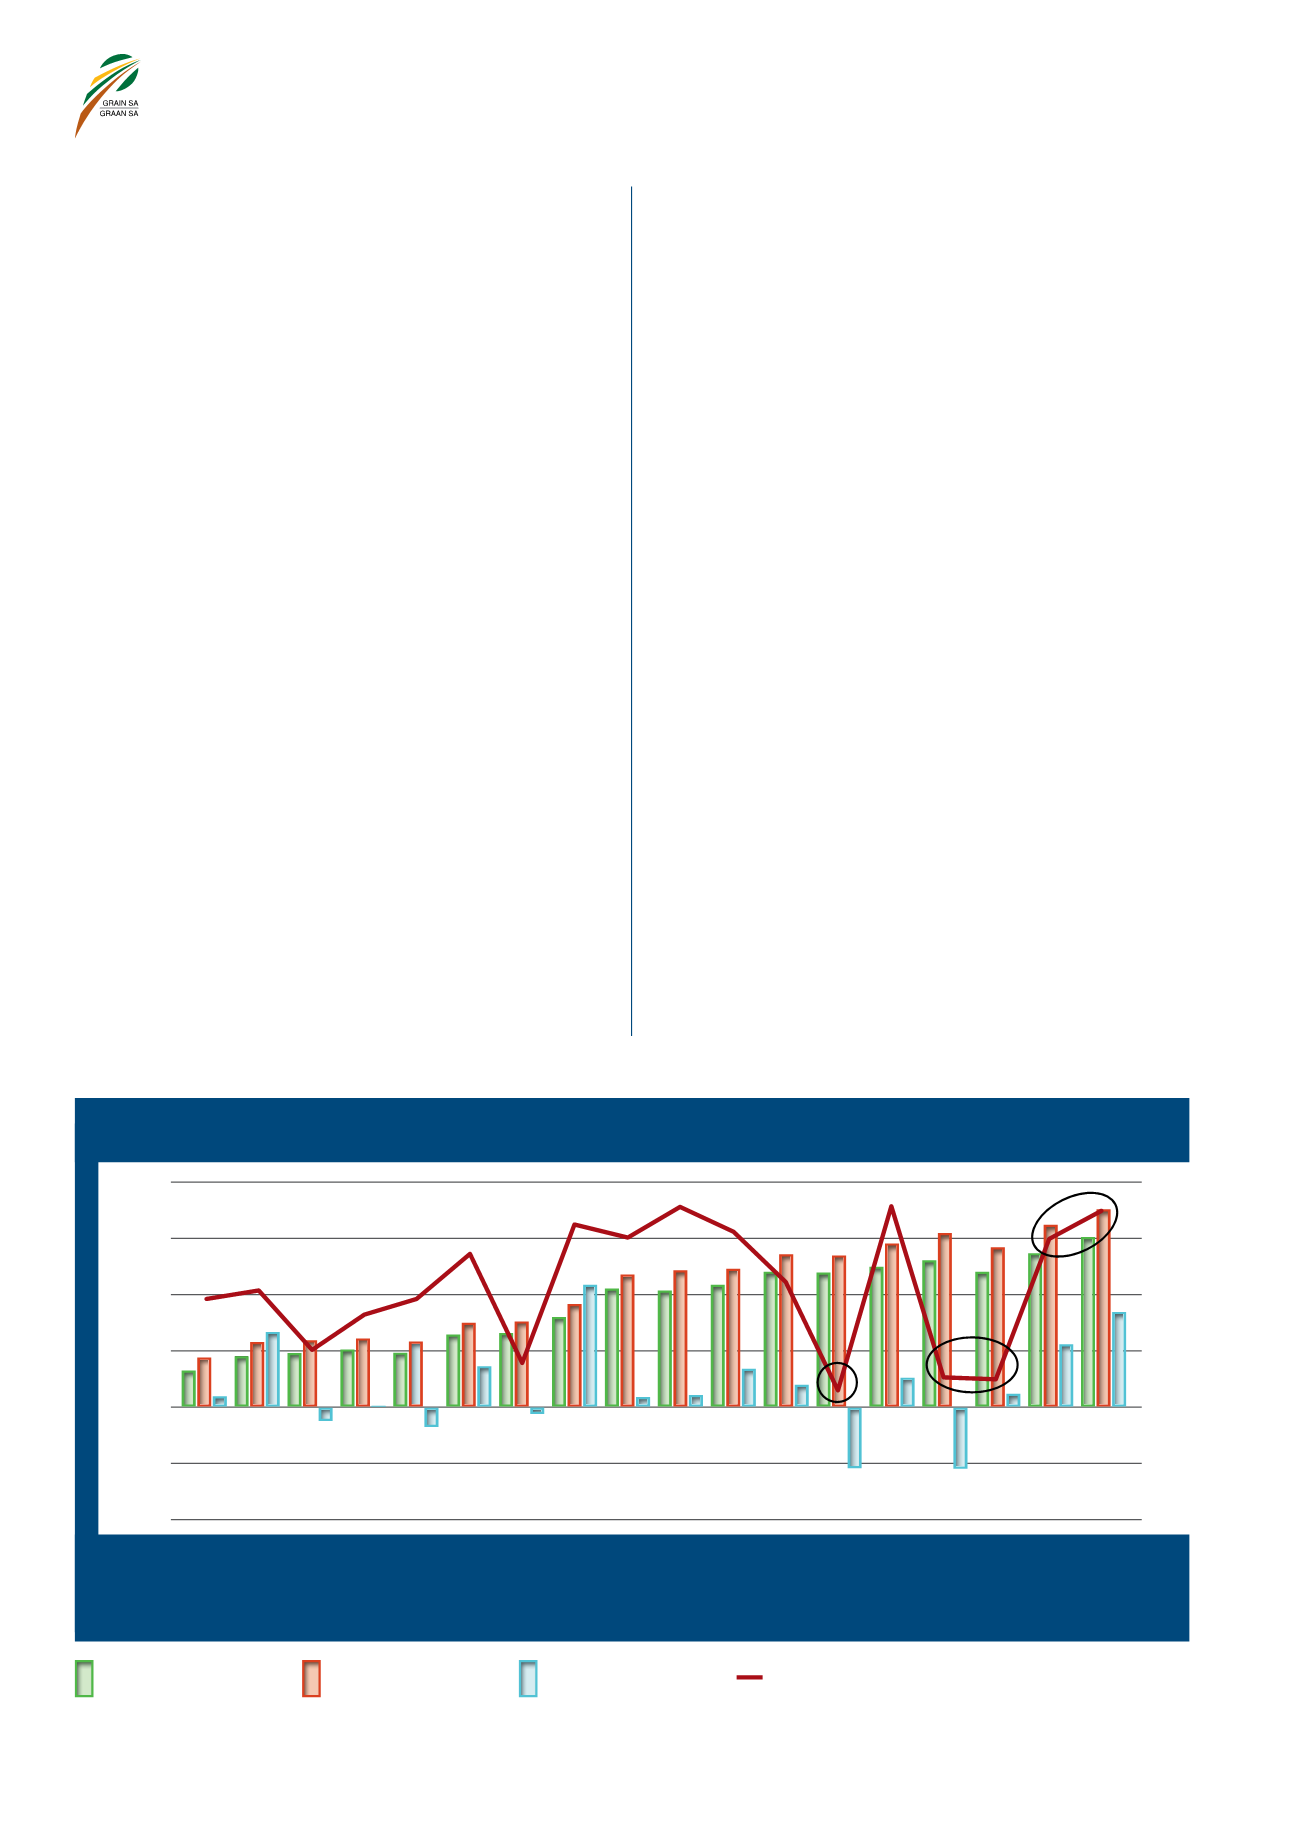
Graph 12
to
15
depict the long-term actual production cost, yields
and profit/loss situation of the North West Province, North Western
Free State, Eastern Free State and KwaZulu-Natal since 2000/2001.
The figures clearly show that production costs are constantly
increasing over time. These increases on a year-on-year basis are
fairly high and have a huge impact on producers to adapt and make
adjustments with their current production systems in order to plant
maize profitably.
Graph 12
clearly depicts that the North West Province experienced
very trying production conditions as poor yields were achieved
during the 2012/2013, 2014/2015 and 2015/2016 seasons. This
region in general experienced very cumbersome conditions putting
pressure on profitable maize production. Better yields were obtained
JAARLIKSE VERGADERING MET SALMA
Graan SA het in 2019 weer met die SA Landboumasjinerieassosiasie
(SALMA) vergader om gemeenskaplike uitdagings in die graan- en
oliesadebedryf te bespreek. Belangrike kwessies wat bespreek is, was
die volgende:
Marktendense en produksiekoste vir die graan- en oliesadebedryf.
Tendense in die internasionale en plaaslike landboumasjineriebedryf.
Logistiek van landboumasjinerie wat nie gelisensieer kan word nie.
Invoerrabat op trekkerbande.
Presisie-ondersteuning.
Gehalte van diesel.
Tegnologieplatforms.
Grys invoere.
PRODUKSIEKOSTE-OORSIG
Werklike produksiekoste
Graan SA het in Desember 2018 en Januarie 2019 data en inligting in-
gesamel/gekoop om die werklike inkomste en produksiekoste van die
belangrikste mielieproduksiegebiede vir die 2017/2018-produksiesei-
soen te bepaal. Dit is vir die bedryf belangrik dat die historiese werklike
inkomste en produksiekostesyfers bepaal en ingesamel word, aange-
sien dit ’n aanduiding gee van die werklike koste van verskillende items
en die winsgewendheid van ’n gewas.
Grafiek 12
tot
15
beeld die langtermyn- werklike produksiekoste,
opbrengs en wins/verlies-situasie vir Noordwes, die Noordwes-Vrystaat,
Oos-Vrystaat en KwaZulu-Natal sedert 2000/2001 uit. Dit is duidelik dat
produksiekoste met verloop van tyd voortdurend styg. Hierdie stygings
op ’n jaar-tot-jaar-grondslag is redelik hoog en het ’n geweldige impak
op produsente se vermoë om hulle huidige produksiestelsels aan te pas
en te wysig om mielies winsgewend te plant.
Grafiek 12
toon duidelik dat Noordwes baie moeilike produksietoe-
stande ervaar het, aangesien swak opbrengste gedurende die
2012/2013-, 2014/2015- en 2015/2016-seisoen behaal is. Hierdie
streek het oor die algemeen baie moeilike toestande ervaar, wat druk
op winsgewende mielieproduksie geplaas het. Beter opbrengste is die
8 000
6 000
4 000
2 000
0
-2 000
-4 000
5
4
3
2
1
0
-1
R/ha
t/ha
GRAPH 12 – Actual production cost, yield and profit/loss of maize for the North West.
GRAFIEK 12 – Werklike produksiekoste, opbrengs en wins/verlies van mielies in Noordwes.
2000/2001
2001/2002
2002/2003
2003/2004
2004/2005
2005/2006
2006/2007
2007/2008
2008/2009
2009/2010
2010/2011
2011/2012
2012/2013
2013/2014
2014/2015
2015/2016
2016/2017
2017/2018
Source: Grain SA
Bron: Graan SA
Total cost per ha
Totale koste per ha
Profit/loss per ha
Wins/verlies per ha
Total variable cost
Totaal lopende koste
Yield (t/ha)
Opbrengs (t/ha)