


 78 / 116

76
Contribution of different variable input cost items
to the total variable input cost of maize
The main focus of this section is to express different variable input cost
items as a percentage of the total variable input costs.
NORTH WESTERN FREE STATE
Graph 16
shows the average percentage contribution of selected
variable input costs during two different seasons with maize produc-
tion in the North Western Free State. Fertiliser and lime, which are the
biggest contributing inputs for a maize producer, contributed a cal-
culated 30% during the 2010/2011 season and increased to 33,2% to
the total variable input cost seven seasons later.
Fuel contributed 13% to the total variable input cost during the
2010/2011 season. The decrease in fuel usage is evident as the latest
information indicates a contribution of 11,4%; this is due to the change
in producer’s production practises. Repairs and parts contributed 9,0%
and showed a declining trend in terms of its relative contribution to the
total variable input cost. Seed cost showed an increase in its relative
contribution to the total variable input cost, while the cost for chemical
control also increased from 7% during 2010/2011 to 9,5% in 2017/2018
of the total variable input cost. This is simply to illustrate the type of long-
term information that is gathered through this project.
KWAZULU-NATAL
Graph 17
shows the same information as the above but only for
KwaZulu-Natal. Fertiliser and lime contributed a calculated 31% during
the 2010/2011 season but slightly decreased to 30% of the total variable
input cost seven seasons later.
Seed cost is the second biggest contributing input of a maize
producer in the eastern parts of the country, contributing a calculated
18% during the 2017/2018 season. Chemical control contributed 14%
to the total variable input cost during 2010/2011 but decreased to 12%
seven years later.
BUDGETED INCOME AND PRODUCTION COST FIGURES
FOR MAIZE (2019/2020 PRODUCTION SEASON)
With the 2019/2020 season approaching, it is once again time to make
some calculations. The analysis of gross margins is a common and
Bydrae van verskillende veranderlike-insetkoste-items
tot die totale veranderlike insetkoste van mielies
Die vernaamste fokus van hierdie afdeling is om verskillende veran-
derlike-insetkoste-items as ’n persentasie van die totale veranderlike
insetkoste uit te druk.
NOORDWES-VRYSTAAT
Grafiek 16
toon die gemiddelde persentasiebydrae van geselekteerde
veranderlike insetkoste tot mielieproduksie in die Noordwes-Vrystaat
tydens twee verskillende seisoene. Kunsmis en kalk, wat die grootste
bydraende insette vir ’n mielieprodusent is, het in die 2010/2011-seisoen
’n berekende 30% bygedra, en dit het sewe seisoene later tot 33,2% van
die totale veranderlike insetkoste toegeneem.
Brandstof het in die 2010/2011-seisoen 13% tot die veranderlike inset-
koste bygedra. Die daling in brandstofverbruik is duidelik, aangesien
die jongste inligting as gevolg van die verandering in produsente se
produksiepraktyke op ’n bydrae van 11,4% dui. Herstelwerk en on-
derdele het 9,0% bygedra en ’n dalende tendens ten opsigte van die
relatiewe bydrae tot die totale veranderlike insetkoste getoon. Saad-
koste het ’n styging in die relatiewe bydrae tot die totale veranderlike
insetkoste getoon, terwyl die koste vir chemiese beheer ook vanaf 7%
van die totale veranderlike insetkoste in 2010/2011 tot 9,5% in 2017/2018
gestyg het. Dit illustreer die tipe langtermyninligting wat met behulp van
hierdie projek ingesamel word.
KWAZULU-NATAL
Grafiek 17
toon dieselfde inligting as hierbo, maar net vir KwaZulu-
Natal. Kunsmis en kalk het in die 2010/2011-seisoen ’n berekende 31%
bygedra, en dit het sewe seisoene later effens tot 30% van die totale
veranderlike insetkoste gedaal.
Saadkoste is die tweede grootste bydraende inset vir ’n mielieprodusent
in die oostelike dele van die land en het in die 2017/2018-seisoen ’n bere-
kende 18% bygedra. Chemiese beheer het in 2010/2011 14% tot die ver-
anderlike insetkoste bygedra, maar dit het sewe jaar later tot 12% gedaal.
BEGROTE INKOMSTE- EN PRODUKSIEKOSTESYFERS
VIR MIELIES (2019/2020-PRODUKSIESEISOEN)
Met die 2019/2020-seisoen wat naderkom, is dit weer eens tyd om
berekeninge te doen. Die ontleding van bruto marges is ’n algemene
16 000
14 000
12 000
10 000
8 000
6 000
4 000
2 000
0
R/ha
2002/2003
2003/2004
2004/2005
2005/2006
2006/2007
2007/2008
2008/2009
2009/2010
2010/2011
2011/2012
2012/2013
2013/2014
2014/2015
2015/2016
2016/2017
2017/2018
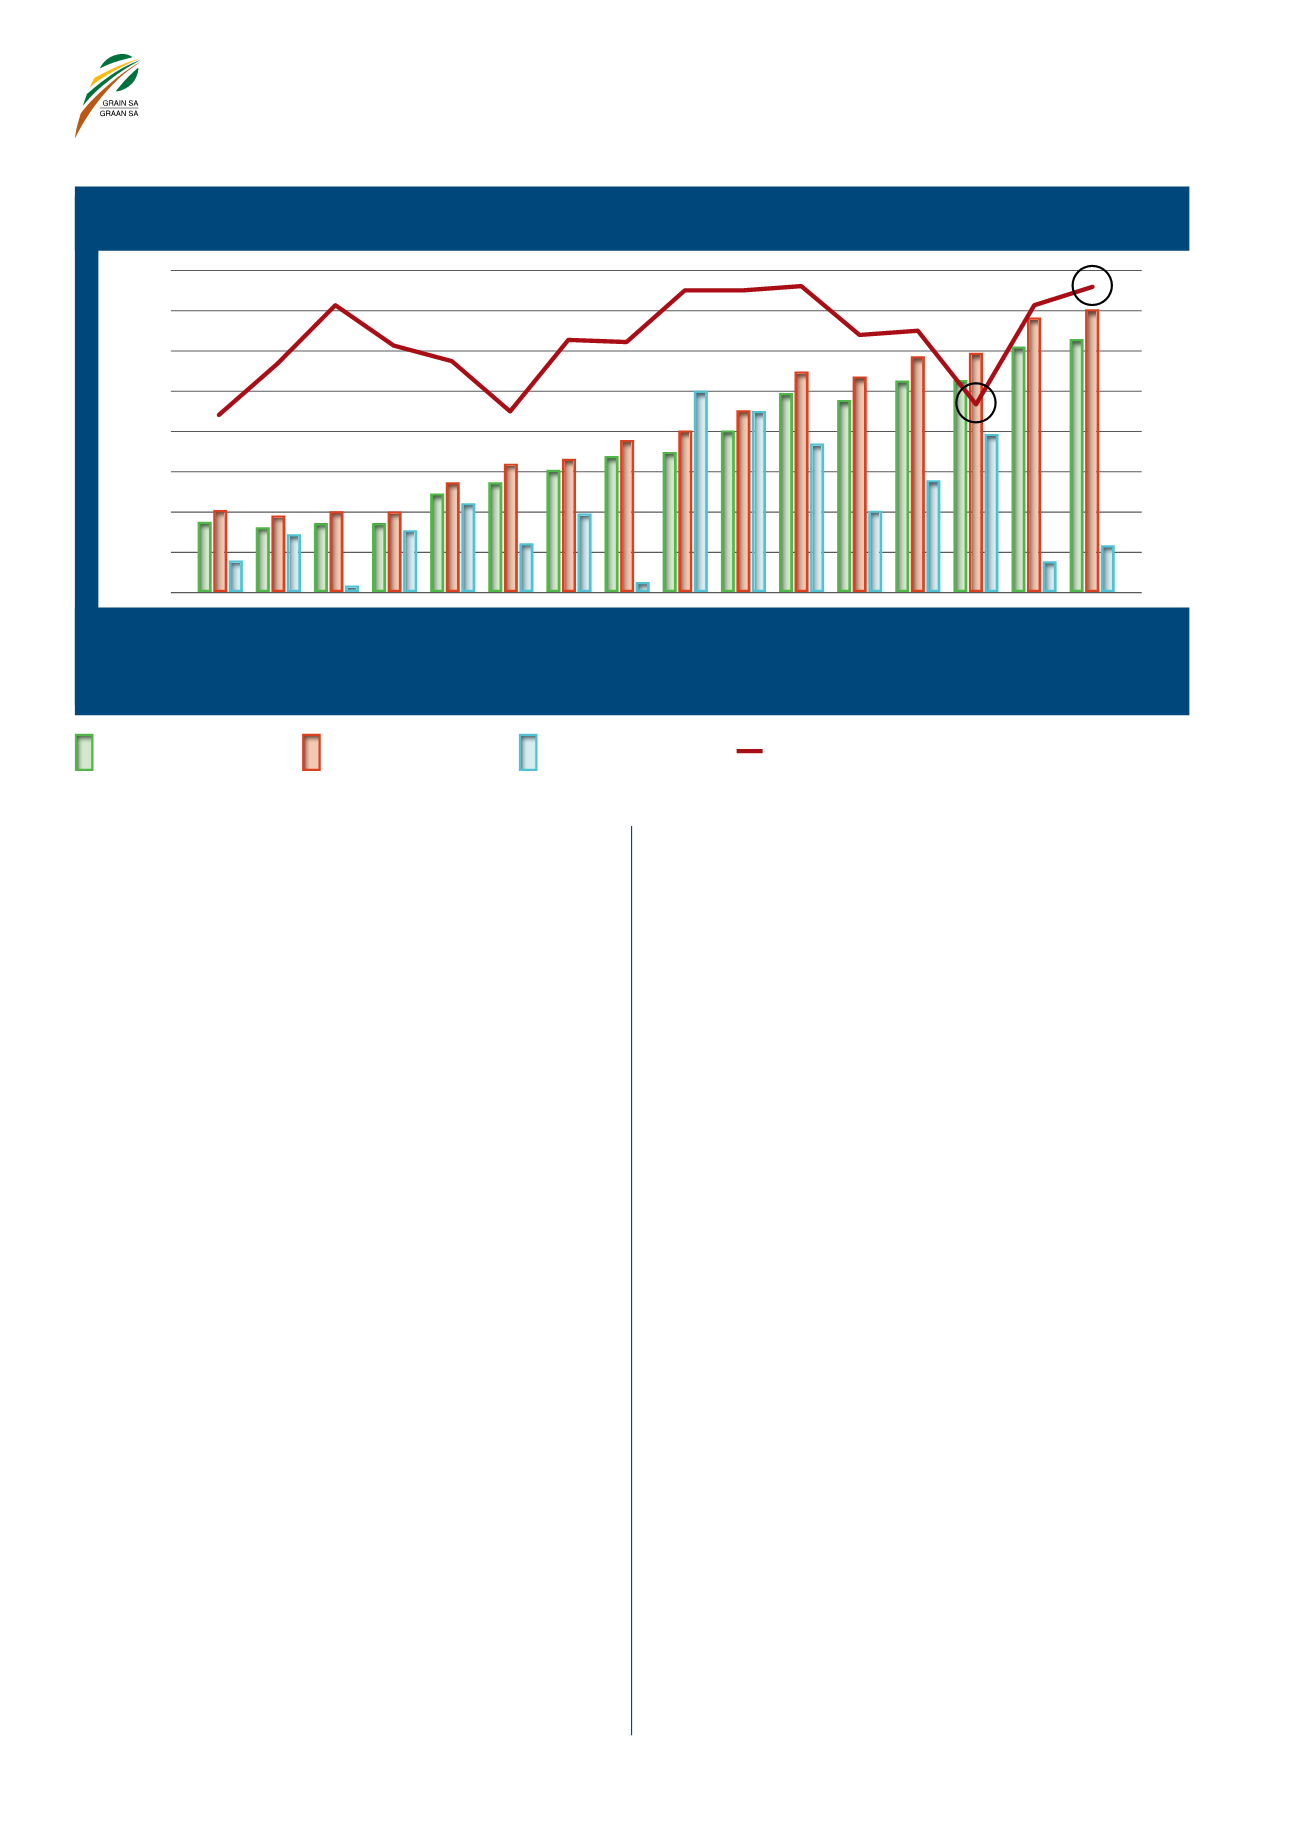
Source: Grain SA
Bron: Graan SA
9
8
7
6
5
4
3
2
1
0
t/ha
GRAPH 15 – Actual production cost, yield and profit/loss of maize for KwaZulu-Natal.
GRAFIEK 15 – Werklike produksiekoste, opbrengs en wins/verlies van mielies in KwaZulu-Natal.
Total cost per ha
Totale koste per ha
Profit/loss per ha
Wins/verlies per ha
Total variable cost
Totaal lopende koste
Yield (t/ha)
Opbrengs (t/ha)