


 77 / 116

75
for the North West Province the last two seasons (2016/2017 and
2017/2018) compared to the previous drought year (2015/2016).
The difference in yields between the past contrasting climatic seasons
is evident in all the graphs.
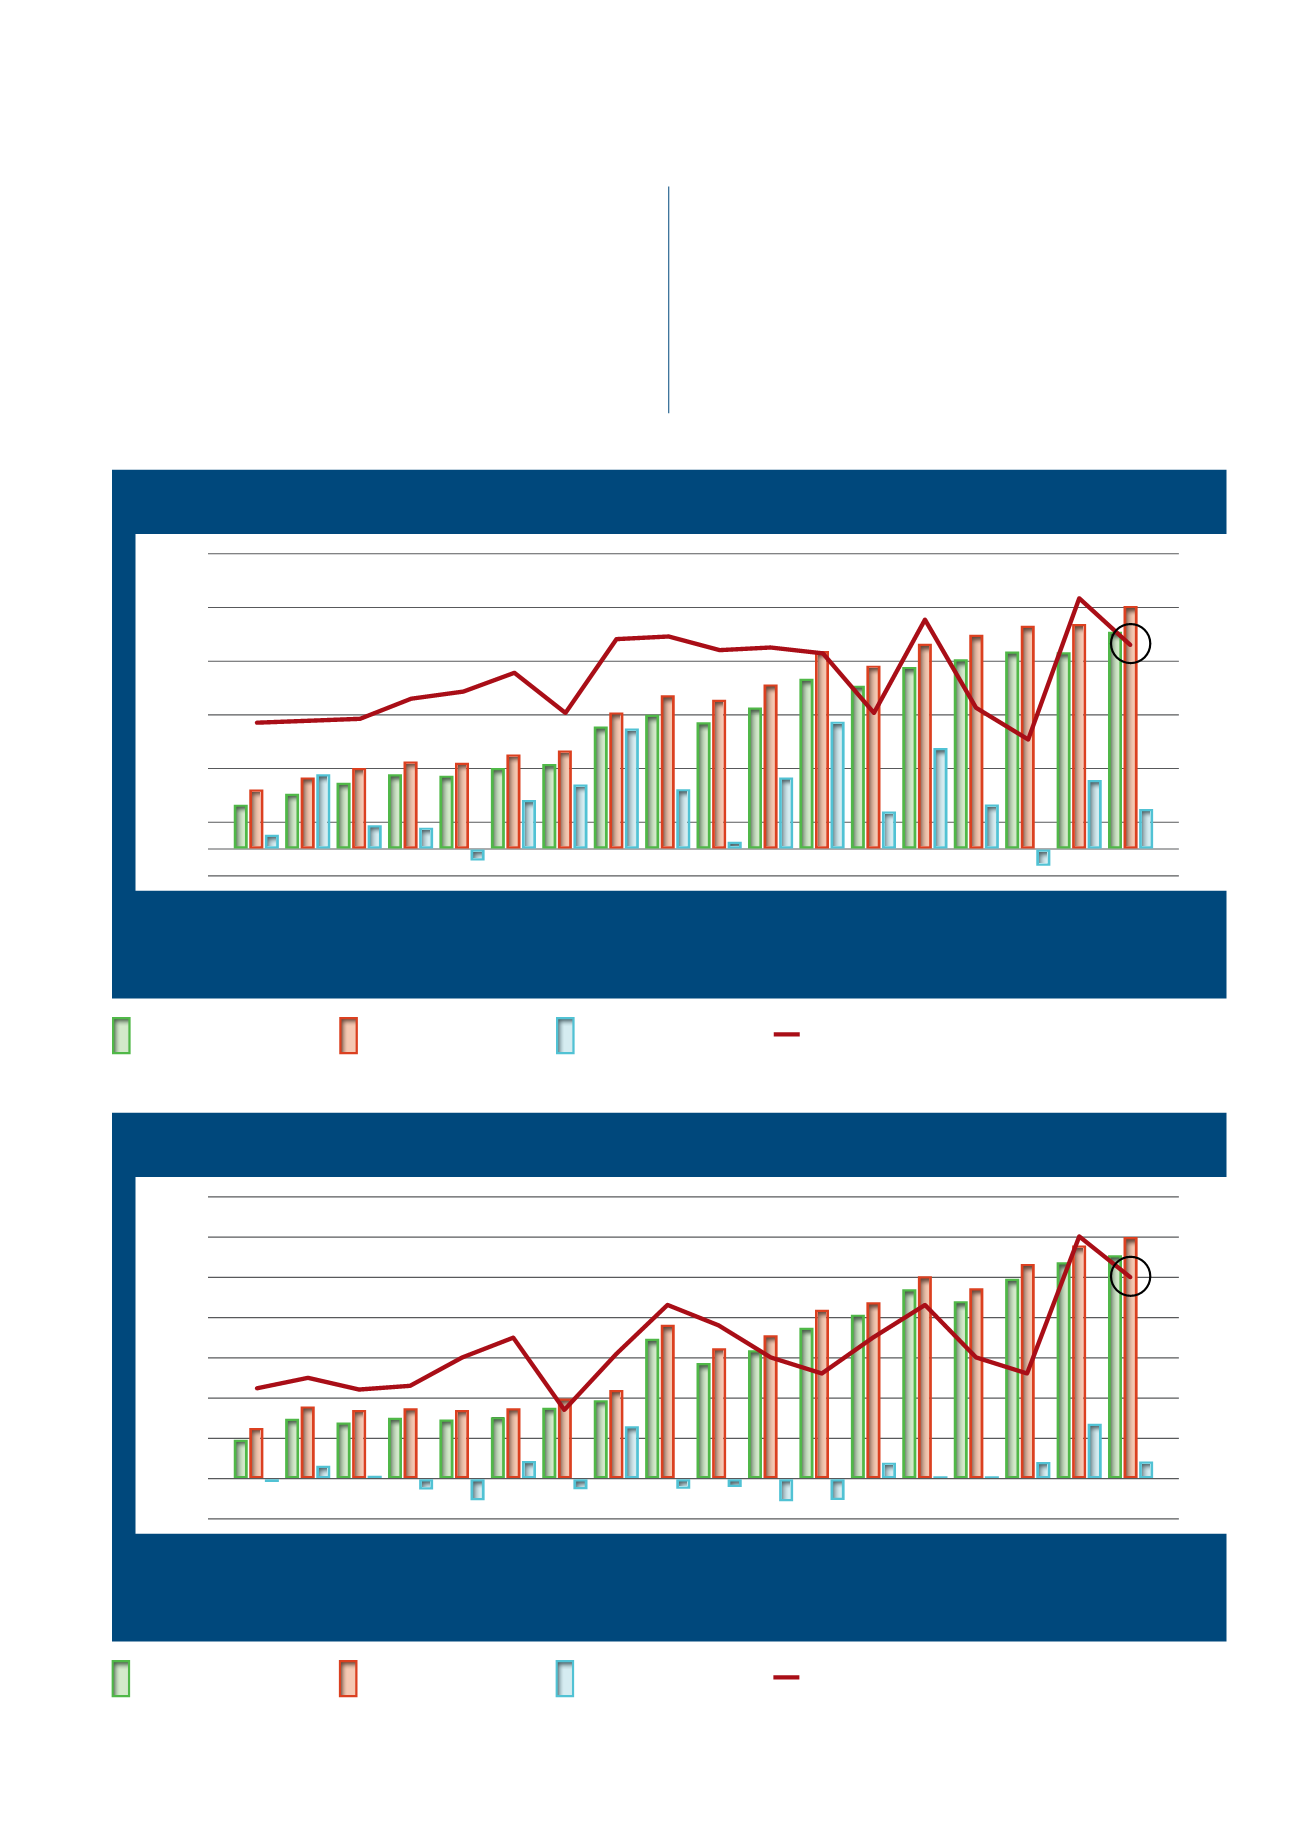
Graph 12
shows that the 2015/2016 pro-
duction season’s drought was very intense and had a big impact on
yield compared to the 2016/2017 yields where very good yields were
achieved due to favourable climatic conditions. South Africa produced
its lowest volume of maize, apart from the 2006/2007 season, during
the 2015/2016 production season whereas a record maize crop was
obtained the following year (2016/2017).
afgelope twee seisoene (2016/2017 en 2017/2018) in Noordwes behaal
vergeleke met die vorige droogtejaar (2015/2016).
Die verskil in opbrengste tussen die kontrasterende klimaatseisoene
in die verlede is duidelik uit al die grafieke.
Grafiek 12
toon dat die
2015/2016-produksieseisoen se droogte baie erg was en ’n groot impak
op opbrengs gehad het, vergeleke met die 2016/2017-opbrengste,
toe baie goeie opbrengste as gevolg van gunstige klimaatstoestande
behaal is. Buiten die 2006/2007-seisoen, het Suid-Afrika sy laagste
volume mielies tydens die 2015/2016-produksieseisoen behaal, terwyl
’n rekordmielieoes in die volgende jaar (2016/2017) behaal is.
11 000
9 000
7 000
5 000
3 000
1 000
-1 000
R/ha
GRAPH 13 – Actual production cost, yield and profit/loss of maize for the North Western Free State.
GRAFIEK 13 – Werklike produksiekoste, opbrengs en wins/verlies van mielies in die Noordwes-Vrystaat.
2000/2001
2001/2002
2002/2003
2003/2004
2004/2005
2005/2006
2006/2007
2007/2008
2008/2009
2009/2010
2010/2011
2011/2012
2012/2013
2013/2014
2014/2015
2015/2016
2016/2017
2017/2018
Total cost per ha
Totale koste per ha
Profit/loss per ha
Wins/verlies per ha
Total variable cost
Totaal lopende koste
Yield (t/ha)
Opbrengs (t/ha)
Source: Grain SA
Bron: Graan SA
8
7
6
5
4
3
2
1
0
t/ha
14 000
12 000
10 000
8 000
6 000
4 000
2 000
0
-2 000
R/ha
2000/2001
2001/2002
2002/2003
2003/2004
2004/2005
2005/2006
2006/2007
2007/2008
2008/2009
2009/2010
2010/2011
2011/2012
2012/2013
2013/2014
2014/2015
2015/2016
2016/2017
2017/2018
Source: Grain SA
Bron: Graan SA
8
7
6
5
4
3
2
1
0
t/ha
GRAPH 14 – Actual production cost, yield and profit/loss of maize for the Eastern Free State.
GRAFIEK 14 – Werklike produksiekoste, opbrengs en wins/verlies van mielies in die Oos-Vrystaat.
Total cost per ha
Totale koste per ha
Profit/loss per ha
Wins/verlies per ha
Total variable cost
Totaal lopende koste
Yield (t/ha)
Opbrengs (t/ha)