


 82 / 116

80
negative impact on yields. In the case of sunflower production in the
North West Province, the profitability situation looks relatively promising
when for example compared to maize.
According to the calculations maize profitability appears to be better
when for example compared to last year. Last year when the maize
budgets where compiled a Safex price of R2 300/ton was used
compared to the current Safex July 2020 price trading at R2 700/ton.
EASTERN PARTS OF THE COUNTRY
Table 8
sets out the production costs for the eastern parts of the
country (Eastern Free State and Eastern Highveld). The production
costs of maize, sunflower and soybeans with different yield targets are
compared for the Eastern Free State while only maize and soybeans
are compared in the Eastern Highveld. According to the production
opbrengste gehad het. In die geval van sonneblomproduksie in Noord-
wes lyk die winsgewendheidsituasie relatief belowend wanneer dit
byvoorbeeld met mielies vergelyk word.
Volgens die berekenings lyk dit asof mielies se winsgewendheid
beter is wanneer dit byvoorbeeld met verlede jaar s’n vergelyk word.
Toe die mieliebegrotings verlede jaar saamgestel is, is ’n Safex-prys
van R2 300/ton gebruik, vergeleke met die huidige Safex-prys van
Julie 2020, wat teen R2 700/ton verhandel.
OOSTELIKE DELE VAN DIE LAND
Tabel 8
sit die produksiekoste vir die oostelike dele van die land (Oos-
Vrystaat en oostelike Hoëveld) uiteen. Vir die Oos-Vrystaat word die
produksiekoste van mielies, sonneblom en sojabone met verskillende
opbrengsmikpunte vergelyk, terwyl slegs mielies en sojabone vir die
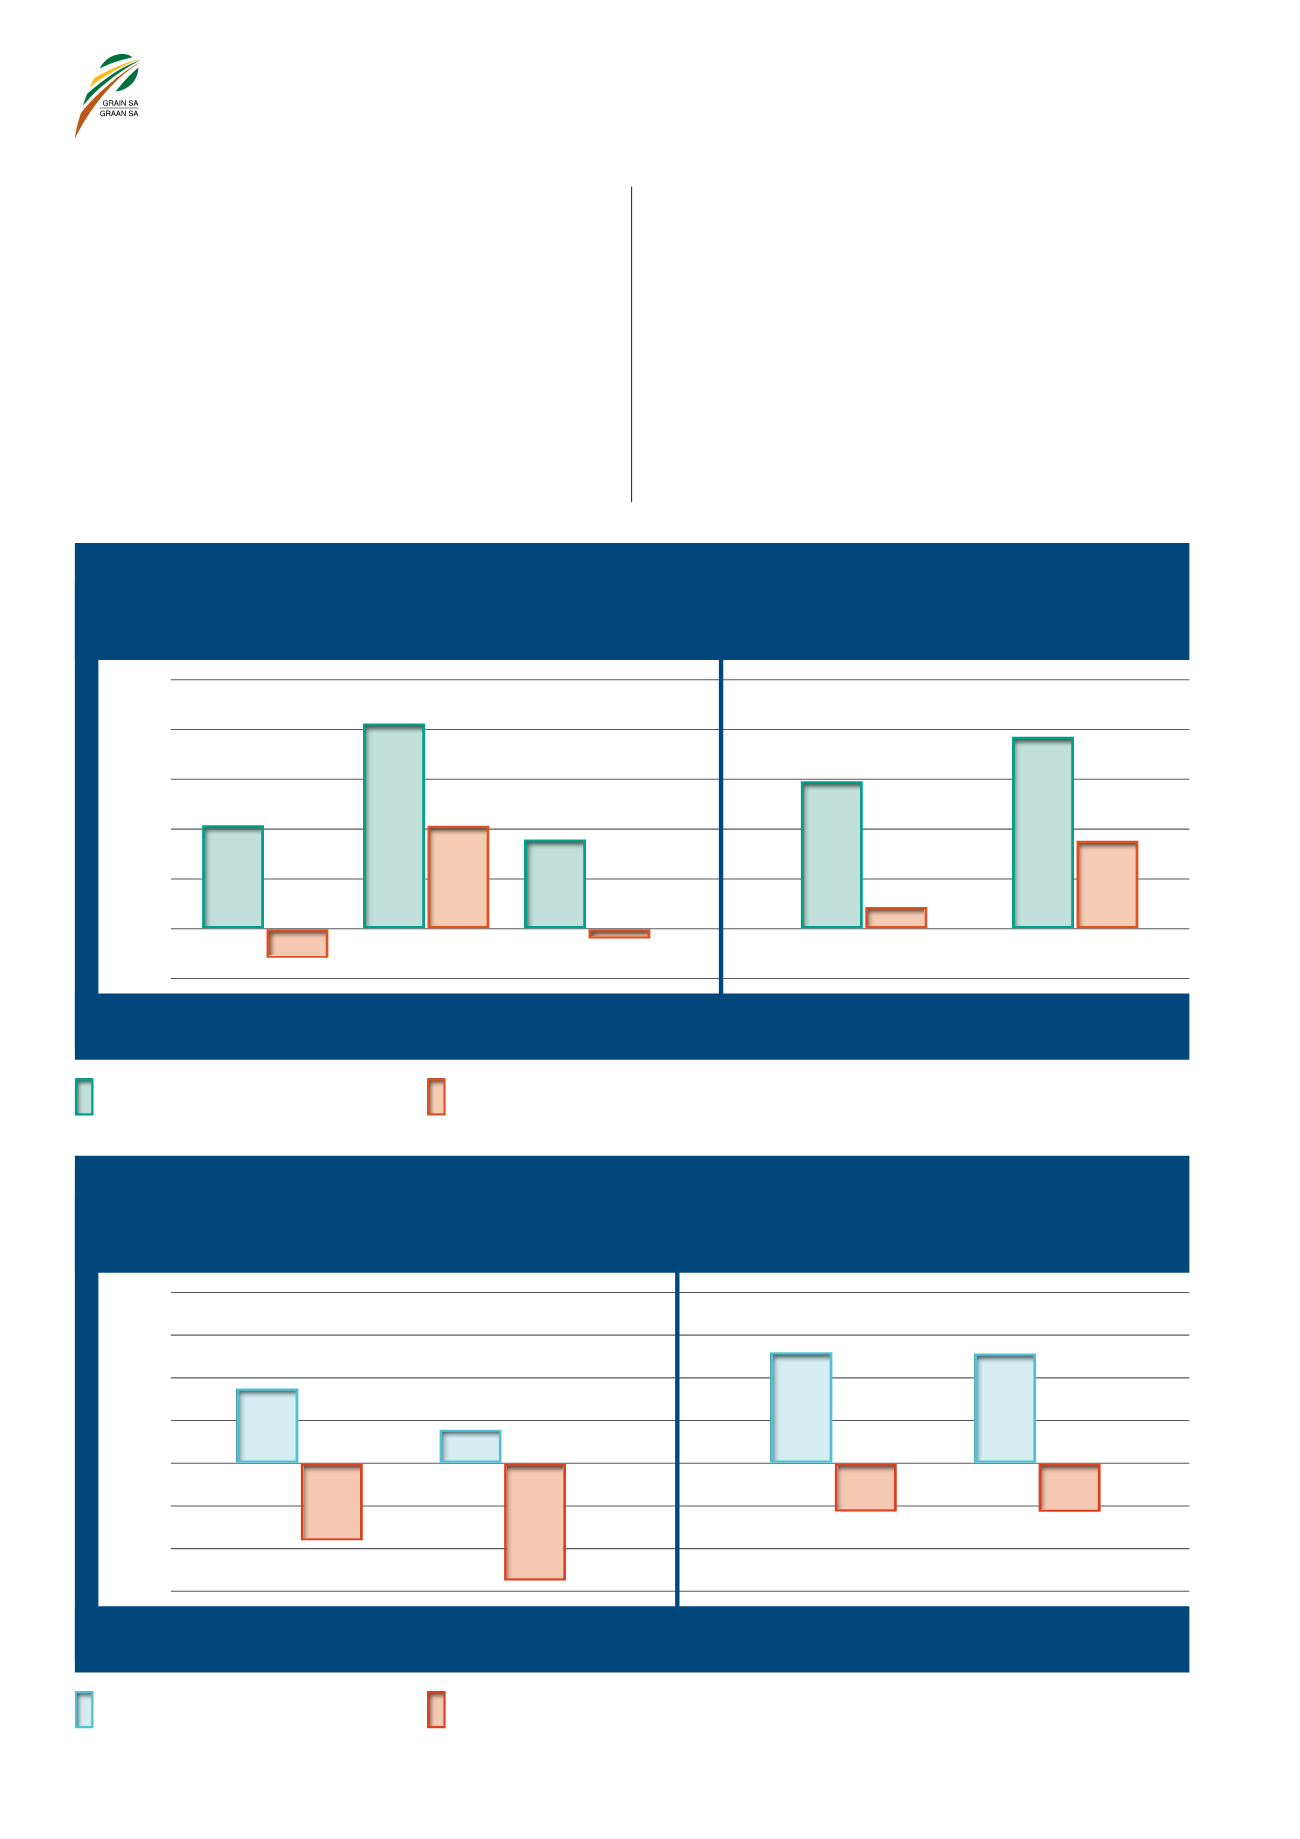
5 000
4 000
3 000
2 000
1 000
0
-1 000
R
Eastern Free State
Oos-Vrystaat
Eastern Highveld
Oostelike Hoëveld
Maize
Mielies
Maize
Mielies
Sunflower
Sonneblom
Soybeans
Sojabone
Soybeans
Sojabone
Net margins (total costs = variable + fixed costs)
Netto marge (totale kostes = veranderlike + vaste kostes)
Gross margins (variable costs only)
Bruto marge (slegs veranderlike kostes)
GRAPH 19 – Margin comparison for summer grain crops in the Eastern Free State and Eastern Highveld
for the 2019/2020 season.
GRAFIEK 19 – Margevergelyking vir somergraangewasse in die Oos-Vrystaat en op die oostelike Hoëveld
vir die 2019/2020-seisoen.
R2 035
R4 090
R2 012
R1 761
R2 924
R3 824
R1 726
R392
-R172
-R564
8 000
6 000
4 000
2 000
0
-2 000
-4 000
-6 000
R
Northern Cape irrigation
Noord-Kaap besproeiing
Limpopo irrigation
Limpopo besproeiing
Irrigation Maize
Besproeiing Mielies
Irrigation Maize
Besproeiing Mielies
Irrigation Soybeans
Besproeiing Sojabone
Irrigation Soybeans
Besproeiing Sojabone
Net margins (total costs = variable + fixed costs)
Netto marge (totale kostes = veranderlike + vaste kostes)
Gross margins (variable costs only)
Bruto marge (slegs veranderlike kostes)
GRAPH 20 – Margin comparison for summer grain crops under irrigation in the Northern Cape and
Limpopo for the 2019/2020 season.
GRAFIEK 20 – Margevergelyking vir somergraangewasse onder besproeiing in die Noord-Kaap en Limpopo
vir die 2019/2020-seisoen.
R3 474
-R3 463
R1 605
R5 182
R5 168
-R2 138
-R2 123
-R5 332