


 83 / 116

81
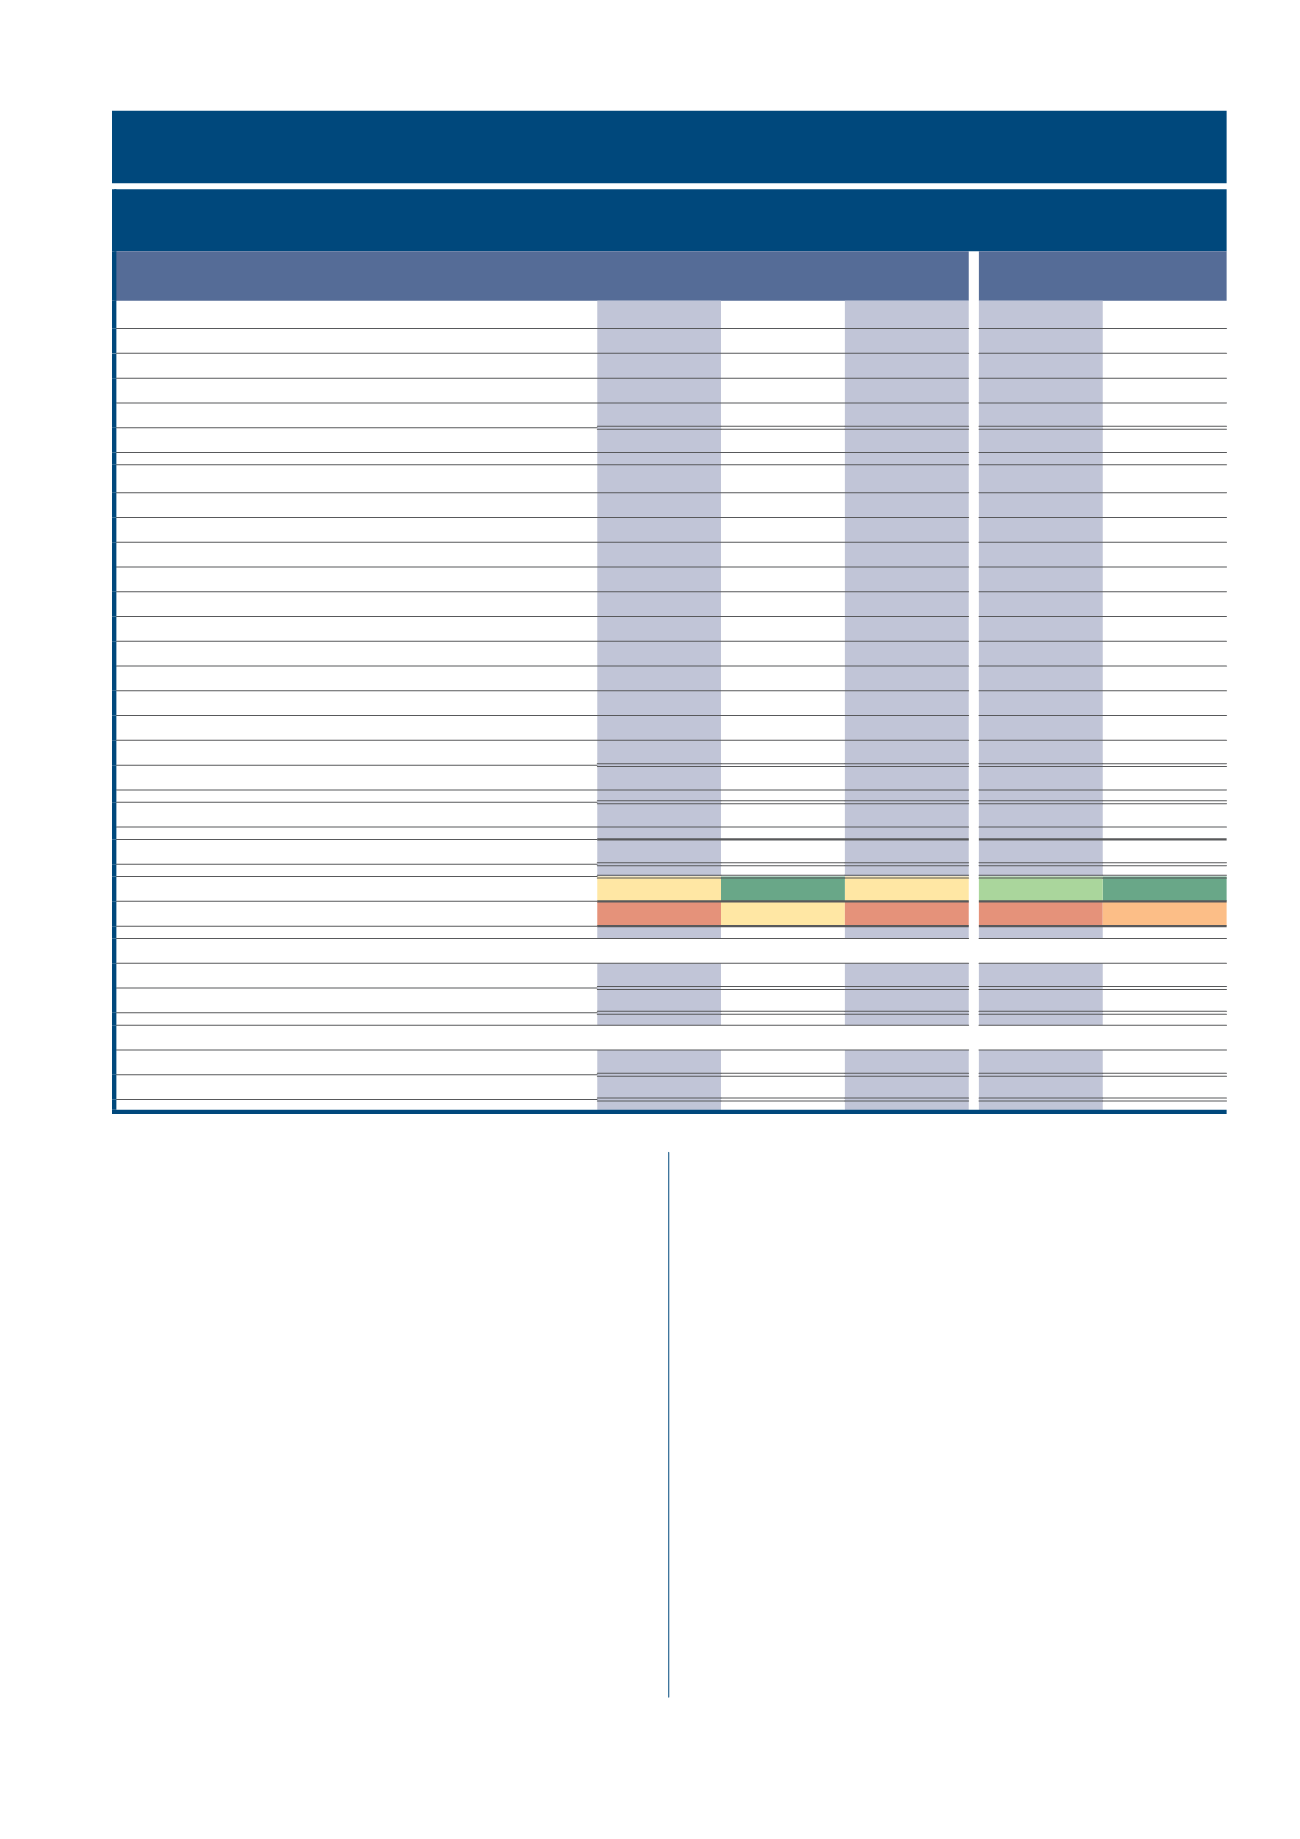
TABLE 8 – Comparison of production cost budgets for summer grain for the 2019/2020 season (eastern region).
TABEL 8 – Vergelyking van produksiekostebegrotings vir somergraan vir die 2019/2020-seisoen (oostelike streke).
EASTERN FREE STATE
OOS-VRYSTAAT
EASTERN HIGHVELD
OOSTELIKE HOËVELD
Maize
Mielies
Sunflower
Sonneblom
Soybeans
Sojabone
Maize
Mielies
Soybeans
Sojabone
1. Income/Inkomste
Planned yield/Beplande opbrengs (t/ha)
5,00
2,00
1,80
6,00
2,20
Safex price (best grade)/Safex-prys (beste graad) (R/ton)
R2 700
R5 120
R5 300
R2 700
R5 300
Deductions/Aftrekkings (R/ton)
R313
R363
R128
R289
R128
Producer price/Produsenteprys (R/ton)
R2 387
R4 757
R5 172
R2 411
R5 172
Gross income/Bruto inkomste (R/ha)
R11 935
R9 514
R9 310
R14 466
R11 378
2. Variable costs/Veranderlike kostes
Seed/Saad
R1 775
R528
R1 159
R2 209
R1 159
Fertiliser/Kunsmis
R2 266
R1 572
R1 355
R3 183
R2 280
Lime/Kalk
R530
R-
R-
R210
R-
Fuel/Brandstof
R1 032
R808
R818
R992
R848
Repairs/Reparasie
R871
R717
R731
R706
R525
Herbicides/Onkruiddoders
R799
R614
R862
R1 216
R1 104
Pesticides/Plaagdoder
R558
R25
R671
R756
R317
Input insurance/Insetversekering
R233
R212
R304
R282
R204
Grain price hedging/Graanprysverskansing
R707
R257
R327
R838
R326
Crop insurance/Oesversekering
R375
R409
R943
R548
R398
Production credit interest/Produksiekrediet-rente
R754
R283
R379
R602
R394
Total variable costs/Totale veranderlike koste (R/ha)
R9 900
R5 424
R7 549
R11 542
R7 555
Total fixed costs/Totale vaste koste (R/ha)
R2 599
R2 078
R1 933
R2 533
R2 098
Total costs/Totale koste (R/ha)
R12 499
R7 502
R9 482
R14 074
R9 653
3. Gross margin/Bruto marge (R/ha)
R2 035
R4 090
R1 761
R2 924
R3 824
4. Net margin/Netto marge (R/ha)
-R564
R2 012
-R172
R392
R1 726
Breakeven (variable costs only)/Gelykbreek (slegs veranderlike koste)
Yield/Opbrengs (t/ha)
4,15
1,14
1,46
4,79
1,46
Safex price/Safex-prys (R/ha)
2 293
3 075
4 322
2 213
3 562
Breakeven (variable + fixed cost)/Gelykbreek (veranderlike + vaste koste)
Yield/Opbrengs (t/ha)
5,24
1,58
1,83
5,84
1,87
Safex price/Safex-prys (R/ha)
2 813
4 114
5 396
2 635
4 516
cost calculations, the variable cost of producing maize in the
Eastern Free State for a 5,0 t/ha yield target is ± R9 900/ha while it is
± R11 542 for a 6,0 t/ha yield target. If this relatively higher Safex price is
to realise at the estimated budgeted input costs (excluding fixed costs),
a producer in the Eastern Free State should harvest 4,15 t/ha, to break-
even where a producer in the Eastern Highveld should harvest 4,79 t/ha
to break-even. The problem and concern is that when the break-even
yields for the total costs (including fixed costs) are calculated and all
maize producer's costs cannot be covered.
Table 8
further illustrates the breakdown of input costs for the
cultivation of soybeans and sunflower. Assumptions where made
when compiling soybean budgets: 50% of the seed cost are retained
by producers while the other 50% is certified seed. The budget also
includes a cost for N, P and K as well as the R65/ton breeding and
technology levy that came into effect on 1 March 2019. Given the input
costs (excluding fixed costs), as shown in
Table 8
for soybeans and
the mentioned Safex price, a yield of approximately 1,46 t/ha in the
Eastern Free State as well as Eastern Highveld should be obtained to
break-even.
Sunflower is only planted on a small scale in the Eastern Free State
and was under severe pressure this past season due to diseases that
had a very negative impact on yields. In the case of sunflower, the
profitability picture seems relatively promising and the break-even
yield and Safex price can be seen in
Table 8
.
oostelike Hoëveld vergelyk word. Volgens die produksiekosteberekeninge
is die veranderlike koste vir die produksie van mielies in die Oos-Vrystaat
vir ’n opbrengsmikpunt van 5,0 t/ha ongeveer R9 900/ha, terwyl dit vir ’n
opbrengsmikpunt van 6,0 t/ha ongeveer R11 542 is. Indien hierdie relatief
hoër Safex-prys teen die geraamde begrote insetkoste (vaste koste uitge-
sluit) moet realiseer, moet ’n produsent in die Oos-Vrystaat 4,15 t/ha oes
om gelyk te breek, terwyl ’n produsent op die oostelike Hoëveld 4,79 t/ha
moet stroop om gelyk te breek. Die probleem en bekommernis is dat wan-
neer die gelykbreekopbrengste vir die totale koste (vaste koste ingesluit)
bereken word, kan al die mielieprodusent se koste nie gedek word nie.
Tabel 8
illustreer verder die uiteensetting van insetkoste vir die verbouing
van sojabone en sonneblom. Aannames is met die samestelling van soja-
boonbegrotings gemaak: 50% van die saadkoste word deur produsente
teruggehou, terwyl die ander 50% gesertifiseerde saad is. Die begroting
sluit ook ’n koste vir N, P en K, en ook die R65/ton teling- en tegnologiehef-
fing in wat op 1 Maart 2019 in werking getree het. Gegewe die insetkoste
(vaste koste uitgesluit), soos in
Tabel 8
vir sojabone aangedui word, en die
gemelde Safex-prys, moet ’n opbrengs van ongeveer 1,46 t/ha in die Oos-
Vrystaat sowel as op die oostelike Hoëveld behaal word om gelyk te breek.
Sonneblom word slegs op klein skaal in die Oos-Vrystaat geplant, en
dit was die afgelope seisoen onder erge druk as gevolg van siektes
wat ’n baie negatiewe impak op opbrengste gehad het. In die geval van
sonneblom lyk die winsgewendheidsprentjie relatief belowend, en die
gelykbreekopbrengs en Safex-prys kan in
Tabel 8
gesien word.