


 73 / 116

71
The agricultural machinery industry
Due to advanced international technology, South Africa imports most of
its agricultural machines, once again making the rand/dollar exchange
rate an important factor in pricing. The strengthening of the rand
therefore contributes to lower agricultural machinery price trends, while
a weaker rand contributes to higher price trends.
PRICES
The prices for agricultural machinery have increased on average by 1,7%
from August 2018 to August 2019, and by 2,0% from September 2018
to September 2019. The year-on-year trend with respect to the change
in the price is a combination of increases in two classes of agricultural
machinery namely tractors and implements and decreases in the other
two, namely; combine harvesters and hay and forage equipment on an
annual basis are shown in
Table 6
.
Graph 8
(on page 72) compares the price indices of the tractor price
and the maize price since 1985/1986. From the graph, it is clear that the
price ratio between tractors and the maize price has slowly converged,
especially due to lower tractor prices over the past year.
TRACTOR SALES
Graph 9
(on page 72) depicts what is currently happening with tractor
sales in the South African market. Note that these figures exclude
TABLE 6 – Price changes in agricultural machinery equipment.
TABEL 6 – Prysveranderings in landboumasjinerietoerusting.
EQUIPMENT CLASS
YEAR-ON-YEAR
CHANGE %
TREND
August
2019
September
2019
Tractors
+1,5
+2,3
Up
Combine harvesters
-4,4
-4,2
Down
Hay and forage equipment
0,0
-0,3
Down
Implements
+1,2
+1,2 No change
General
+1,7
+2,0
Up
TOERUSTINGKLAS
JAAR-TOT-JAAR-
VERANDERING %
TENDENS
Augustus
2019
September
2019
Trekkers
+1,5
+2,3
Opwaarts
Stropers
-4,4
-4,2
Afwaarts
Hooi- en veevoertoerusting
0,0
-0,3
Afwaarts
Implemente
+1,2
+1,2 Geen verandering
Algemeen
+1,7
+2,0
Opwaarts
Bron: AGFACTS
Source: AGFACTS
Die landboumasjineriebedryf
As gevolg van gevorderde internasionale tegnologie voer Suid-Afrika
die meeste van sy landboumasjinerie in, wat weer eens die rand/dollar-
wisselkoers ’n belangrike faktor in prysbepaling maak. Die versterking
van die rand dra dus tot laer pryse op landboumasjinerie by, terwyl ’n
swakker rand tot hoër pryse bydra.
PRYSE
Die pryse van landboumasjinerie het vanaf Augustus 2018 tot Augus-
tus 2019 gemiddeld met 1,7% gestyg, en vanaf September 2018 tot
September 2019 met 2,0%. Die jaar-tot-jaar-tendens ten opsigte van
die verandering in die prys is ’n kombinasie van verhogings in twee
klasse landboumasjinerie, naamlik trekkers en implemente, en dalings
in die ander twee, naamlik stropers en hooi- en voertoerusting, op ’n
jaargrondslag en word in
Tabel 6
getoon.
Grafiek 8
(op bladsy 72) vergelyk die indekse van die trekkerprys en
die mielieprys sedert 1985/1986. Uit die grafiek is dit duidelik dat die
prysverhouding tussen trekkers en mielies stadig nader aan mekaar
beweeg het, veral as gevolg van laer trekkerpryse die afgelope jaar.
TREKKERVERKOPE
Grafiek 9
(op bladsy 72) verteenwoordig wat tans in die Suid-Afrikaanse
mark met trekkerverkope gebeur. Let op dat hierdie syfers uitvoere
350
300
250
200
150
100
50
0
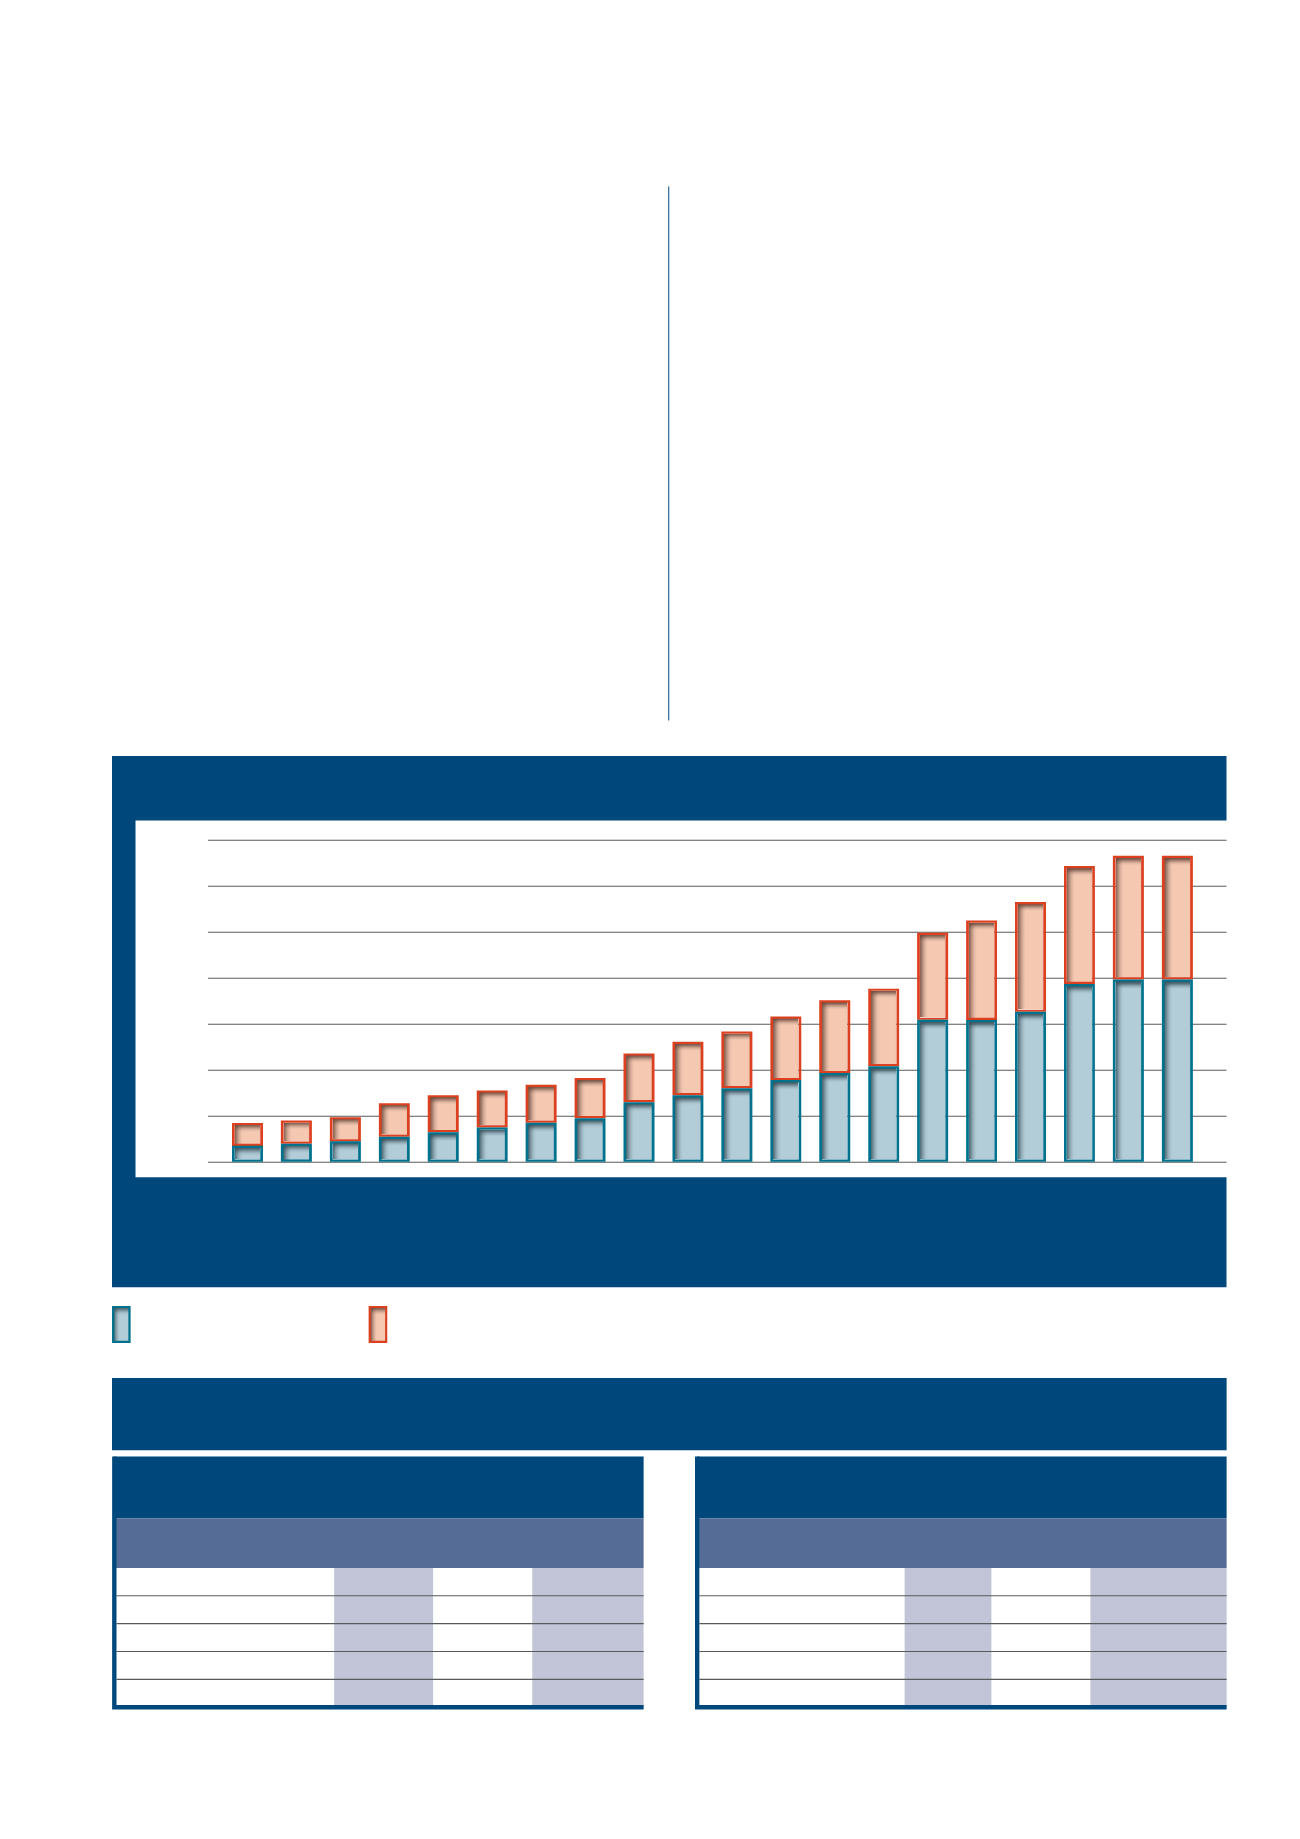
Cents per litre
Sent per liter
GRAPH 7 – Diesel rebate.
GRAFIEK 7 – Dieselrabat.
April 2001
April 2002
April 2003
April 2004
April 2005
April 2006
April 2007
April 2008
April 2009
April 2010
April 2011
April 2012
April 2013
April 2014
April 2015
April 2016
April 2017
April 2018
April 2019
April 2020
Tax
Belasting
Road accident fund
Padongeluksfondsheffing
Source: Grain SA
Bron: Graan SA