15
August 2014
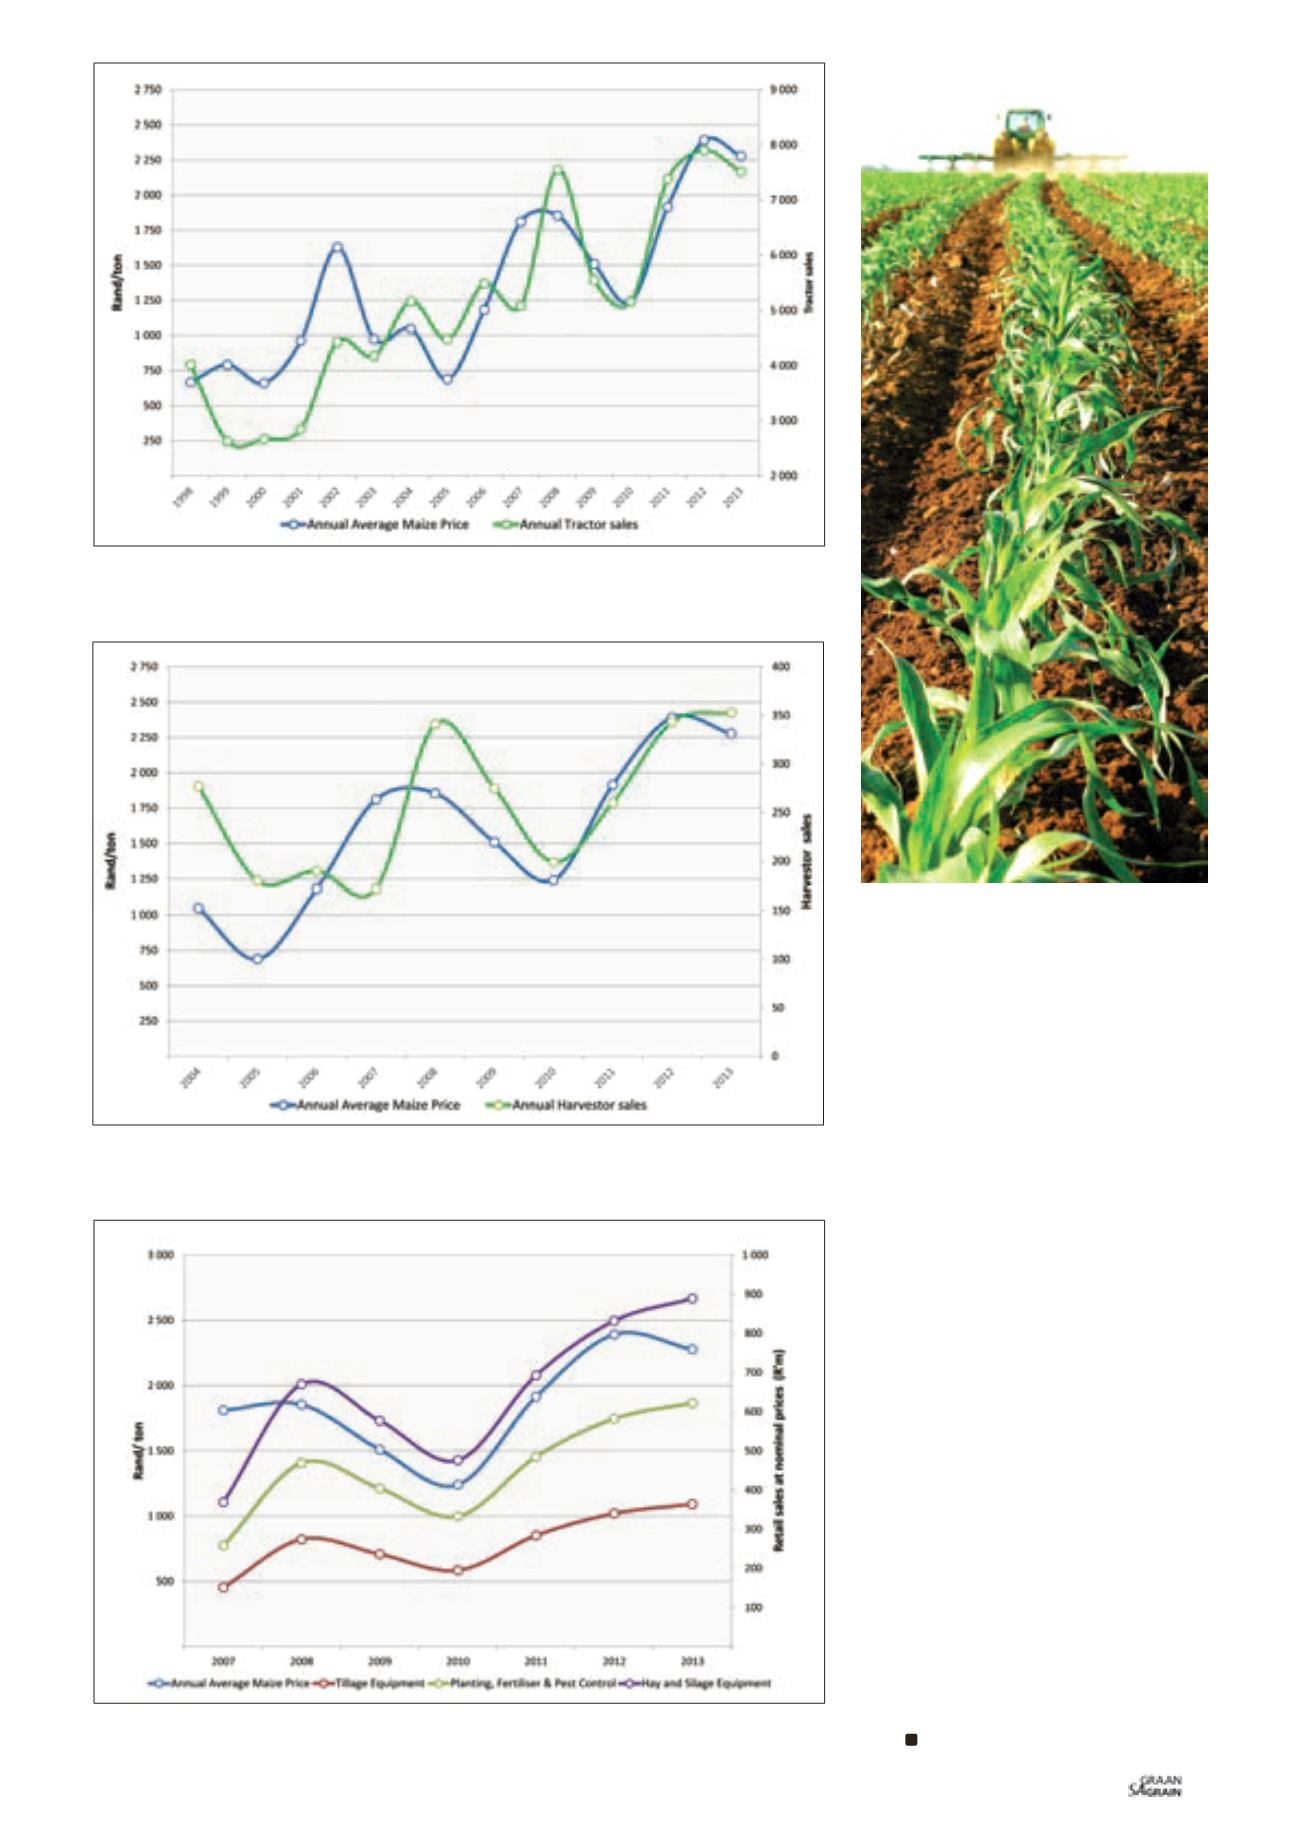
Graph 2: Annual tractor sales versus annual averagemaizeprice.
Source: AGFACTS (2014) andGrainSA (2014)
Graph 3: Annual harvester sales versus annual averagemaizeprice.
Source: AGFACTS (2014) andGrainSA (2014)
Graph 4: Annual averagemaizeprice versus retail sales at nominal prices (R’m).
Source:GrainSA andDirectorateAgriculturalMechanisation/SAAMA/AGFACTS
maize price; with 2010, 2011 and 2012
showing a strong correlation (
Graph 3
).
The last few years’ increase in harvester
and tractor sales can be accounted to
technological advancement; producers
continue to replace and upgrade their
equipment.
Maize price versus other
agricultural machinery and
inputs
Graph 4
compares the retail sales of
tillage equipment, planters, fertiliser, pest
control, aswell ashayand silageequipment
at nominal prices to the average annual
maizeprice.
Thesalesof all these inputsand implements
moved steadily upwards in 2008, and the
same trend was maintained in the follow-
ing years, in line with the decline in the
annual maize prices. However, maize prices
slightly decreased between 2012 and 2013,
but the overall sales for the mentioned
equipment did not follow the trend (it
reached a new all-timehighduring 2013).
Summary
The above analysis shows a strong
correlation between the maize price and
agricultural machinery sales. Currently
(2014), maize prices have been fairly low
compared to the previous years, hence it
can be expected that the same trend will
be apparent to agricultural equipment sales
data.
SAGrain/
Sasol Nitrophoto competition


