


 104 / 143

102
Jaarverslag 2018
annual report 2018
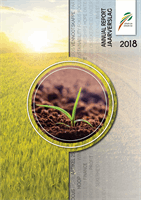
Werklike inkomste en produksiekostesyfers
vir droëlandmielies
Terwyl Tabel 1 die werklike produksiesyfers vir die 2016/2017-
jaar vir die vernaamste verskillende produksiestreke aandui, verskaf
Grafiek 1, 2, 3
en
4
die langtermyn- werklike produksiekoste, op-
brengste en wins/verlies-situasie van Noordwes, Noordwes-Vrystaat,
Oos-Vrystaat en KwaZulu-Natal sedert 2000/2001.
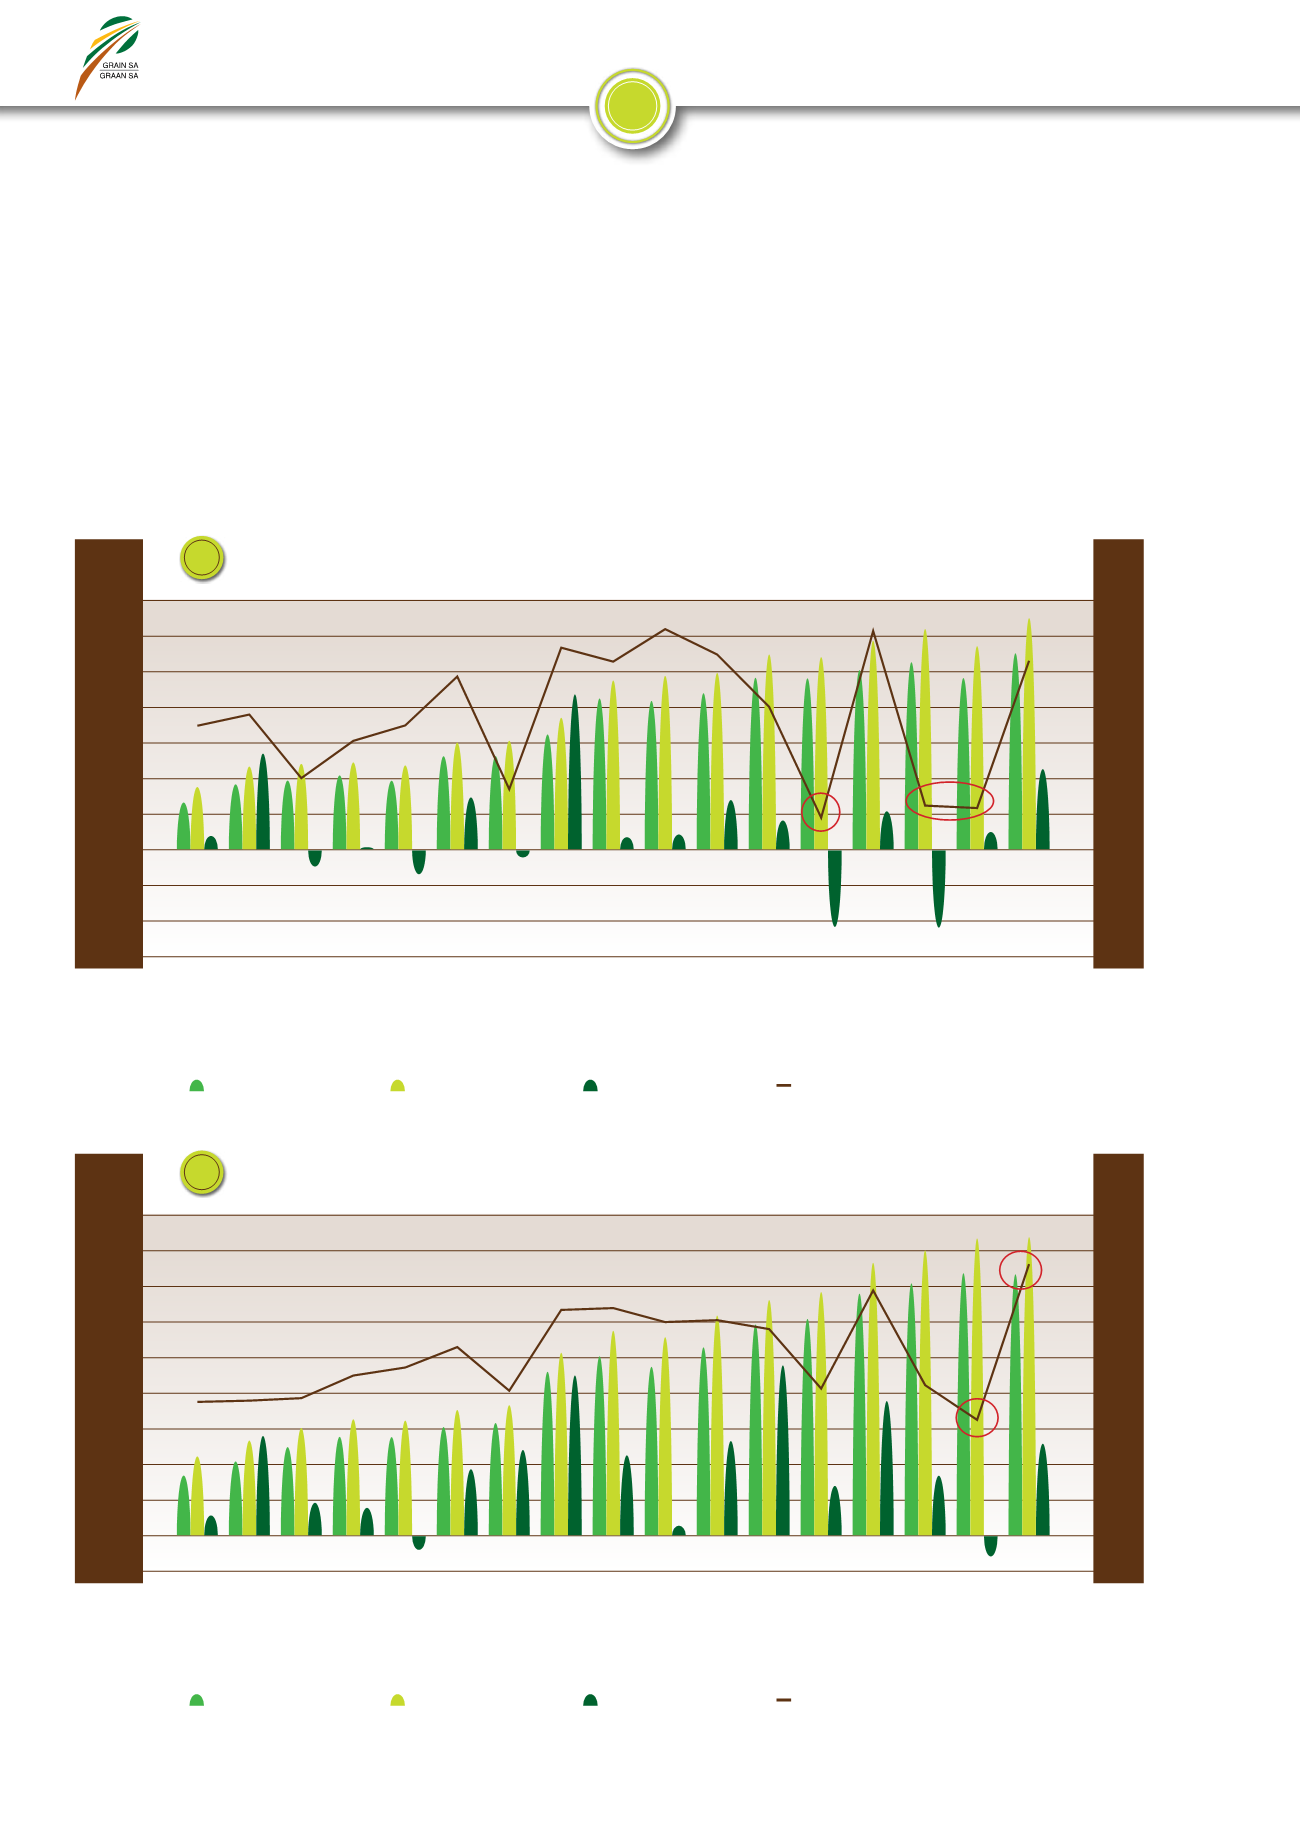
Uit Grafiek 1 tot 4 is dit duidelik dat produksiekoste met verloop
van tyd voortdurend styg. Hierdie stygings op ’n jaar-tot-jaar-grondslag
is redelik hoog en het ’n geweldige impak op produsente se vermoë
om hulle huidige produksiestelsels aan te pas en te wysig om mielies
winsgewend te plant.
Actual income and production cost figures
for dry land maize
While Table 1 depicts the actual production figures for the 2016/2017
year for the main different production regions,
Graph 1
,
2
,
3
and
4
depict the long-term actual production cost, yields and profit/loss
situation of the North West Province, North Western Free State,
Eastern Free State and KwaZulu-Natal seen since 2000/2001.
From Graphs 1 to 4, it is clear that production costs are constantly
increasing over time. These increases on a year-on-year basis are
fairly high and have a huge impact on producers to adapt and make
adjustments with their current production systems in order to produce
maize profitably.
5
4
3
2
1
0
-1
8
7
6
5
4
3
2
1
0
t/ha
t/ha
Actual production cost, yield and profit/loss of maize for the North West Province
Werklike produksiekoste, opbrengs en wins/verlies van mielies in Noordwes
Actual production cost, yield and profit/loss of maize for the North Western Free State
Werklike produksiekoste, opbrengs en wins/verlies van mielies in die Noordwes-Vrystaat
2000/2001
2001/2002
2002/2003
2003/2004
2004/2005
2005/2006
2006/2007
2007/2008
2008/2009
2009/2010
2010/2011
2011/2012
2012/2013
2013/2014
2014/2015
2015/2016
2016/2017
2000/2001
2001/2002
2002/2003
2003/2004
2004/2005
2005/2006
2006/2007
2007/2008
2008/2009
2009/2010
2010/2011
2011/2012
2012/2013
2013/2014
2014/2015
2015/2016
2016/2017
Total variable cost
Totaal lopende koste
Total variable cost
Totaal lopende koste
Total cost per ha
Totale koste per ha
Total cost per ha
Totale koste per ha
Profit/loss per ha
Wins/verlies per ha
Profit/loss per ha
Wins/verlies per ha
Yield (t/ha)
Opbrengs (t/ha)
Yield (t/ha)
Opbrengs (t/ha)
1
2
9 000
8 000
7 000
6 000
5 000
4 000
3 000
2 000
1 000
0
-1 000
R/ha
R/ha
Source: Grain SA
Bron: Graan SA
Source: Grain SA
Bron: Graan SA
7 000
6 000
5 000
4 000
3 000
2 000
1 000
0
-1 000
-2 000
-3 000