


 103 / 143

101
Produksiekoste-oorsig
Werklike produksiekoste
Graan SA het in Desember 2017 en Januarie 2018 data en inligting
ingesamel/gekoop om die werklike inkomste en produksiekoste van die
belangrikste mielieproduksiegebiede vir die 2016/2017-produksiesei-
soen te bepaal. Dit is vir die bedryf uiters belangrik dat die historiese
werklike inkomste en produksiekostesyfers bepaal en ingesamel word,
aangesien dit ’n idee gee van werklike koste per insetitem en die wins-
gewendheid van ’n gewas.
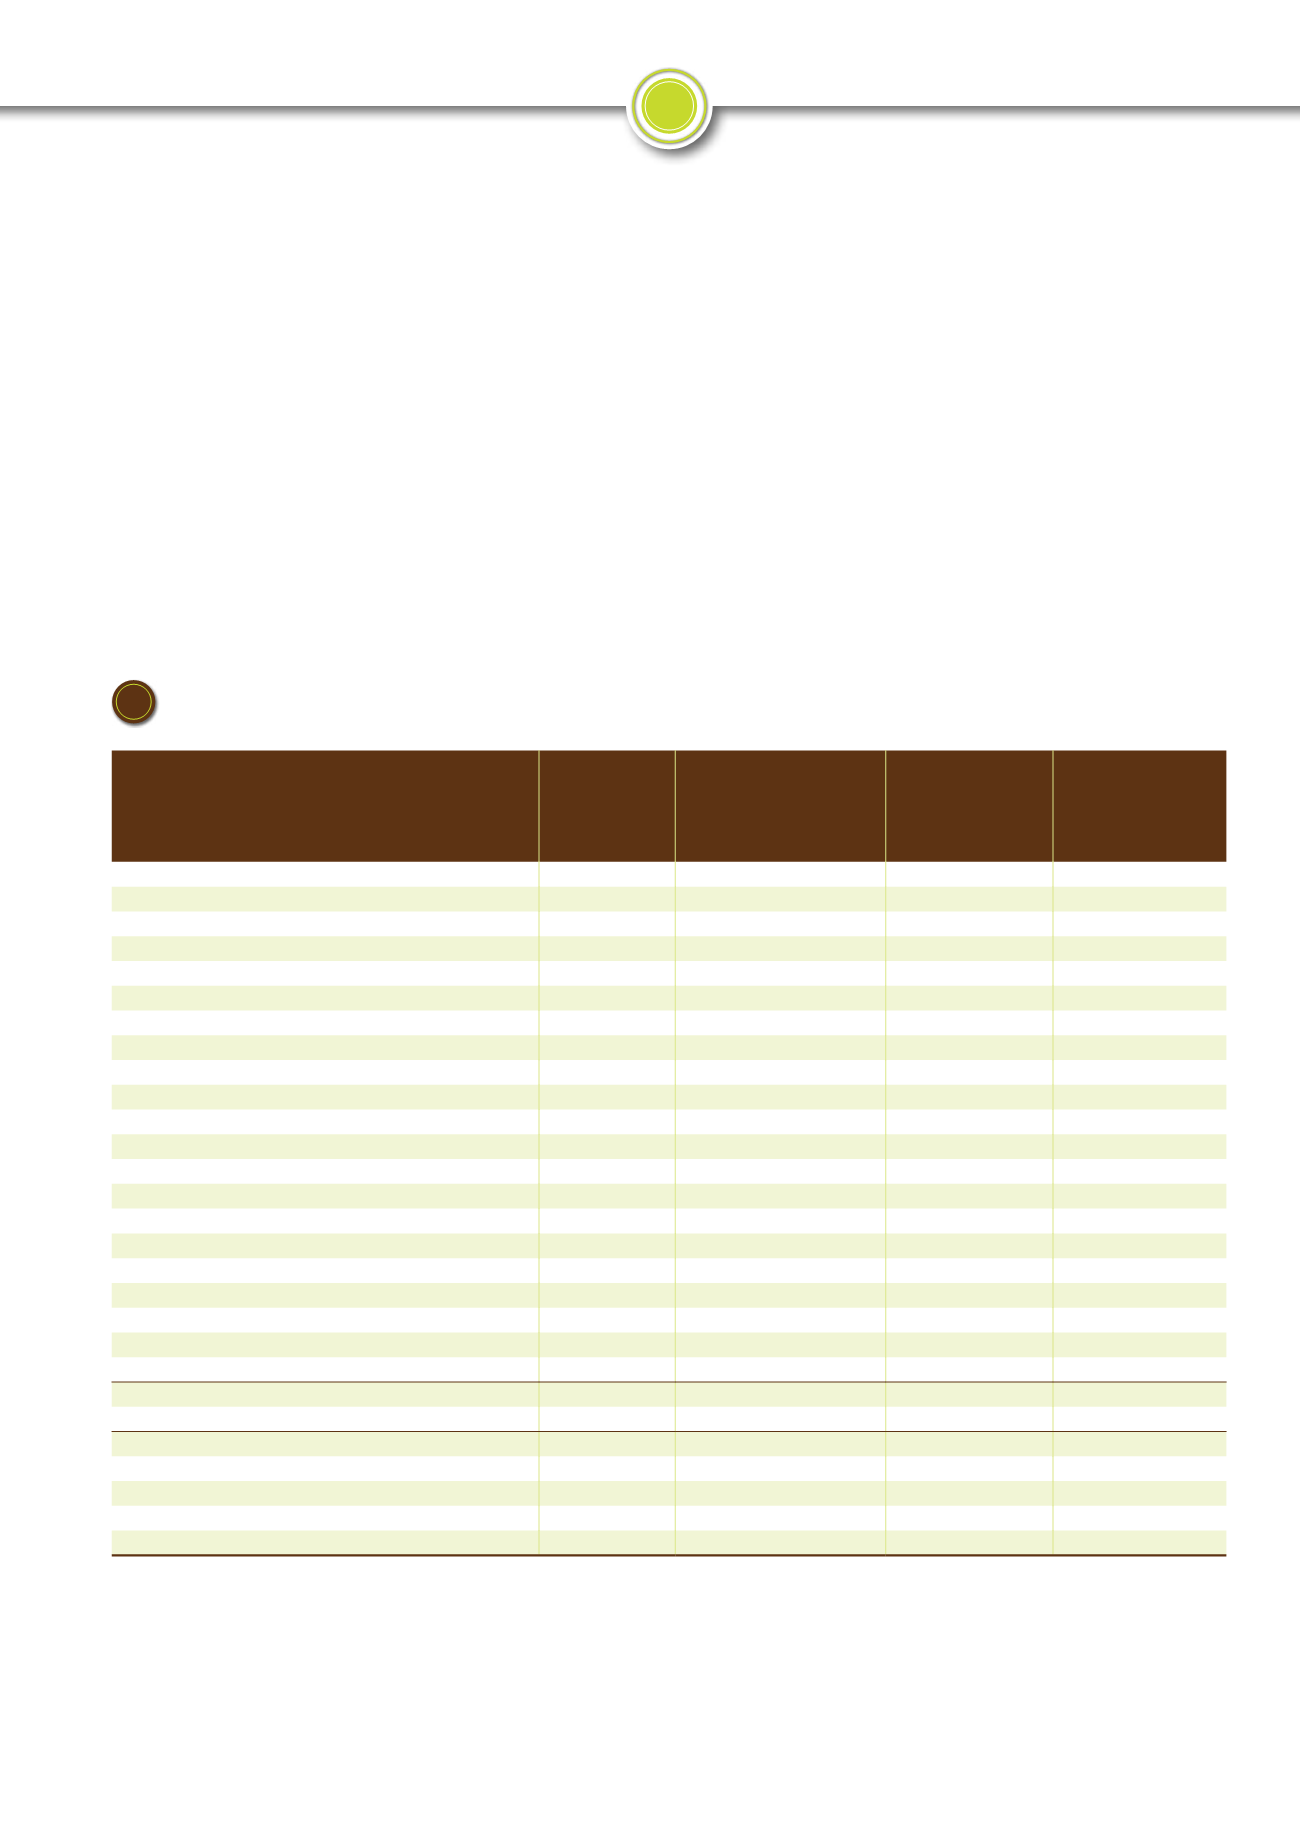
Die werklike inkomste en produksiekoste-ontleding vir droëland-
mielies vir die 2016/2017-produksieseisoen word in
Tabel 1
getoon.
Die tabel toon byvoorbeeld dat die produsente in veral Noordwes
en die Vrystaat die ongunstigste pryse behaal het vergeleke met die
produsente in die ander streke se studiegroepe. Die produsentepryse
wat in Noordwes en die Oos-Vrystaat behaal is, was oor die algemeen
beter. Die tabel toon verder dat uitstekende opbrengste in die alge-
meen behaal is.
Overview of production costs
Actual production cost
Grain SA collected/bought data and information during
December 2017 and January 2018 to determine the actual income
and production costs of the major maize production areas for the
2016/2017 production season. Determining and gathering the
historic actual income and production cost figures is important
to the industry as it gives an idea of actual cost per input item
and the profitability of a crop.
The actual income and production cost analysis for dry land maize
for the 2016/2017 production season can be seen in
Table 1
. The table
shows, for example, that the producers in specifically the North West
Province and Free State Province achieved the most unfavourable
prices compared to the producers in the other regions’ study groups.
The producer prices obtained in the North West and Eastern Free
State were generally better. The table further shows that excellent
yields were generally obtained.
Production cost per hectare
Produksiekoste per hektaar
North West
Noordwes
(R)
North Western
Free State
Noordwes-Vrystaat
(R)
Eastern
Free State
Oos-Vrystaat
(R)
KwaZulu-Natal
(R)
1. Variable cost
/
Veranderlike koste
Seed
/
Saad
677,74
855,59
1470,00
1 989,00
Fertiliser and lime
/
Kunsmis en kalk
1 522,56
2 482,08
2 499,00
4 052,00
Weed and pest control
/
Onkruid- en plaagbeheer
818,20
714,65
1175,00
1 245,00
Fuel
/
Brandstof
540,81
757,70
997,00
997,00
Repairs and parts
/
Herstelwerk en onderdele
428,54
569,51
1 140,00
1 029,00
Crop insurance
/
Gewasversekering
90,36
86,68
362,00
324,00
Casual labour
/
Losarbeid
127,19
55,73
63,00
92,00
Permanent labour
/
Permanente arbeid
334,89
310,54
880,00
927,00
License and insurance
/
Lisensie en versekering
0,00
84,56
0,00
295,00
Marketing cost
/
Bemarkingskoste
260,00
68,89
85,00
0,00
Drying and cleaning cost
/
Droog- en skoonmaakkoste
0,00
35,90
278,00
0,00
Interest on production credit
/
Rente op produksiekrediet
381,77
510,19
748,43
852,15
Contract work
/
Kontrakwerk
53,46
241,60
258,00
305,00
Other cost
/
Ander koste
236,54
539,16
772,00
107,00
Total variable cost
/
Totale veranderlike koste
5 472,06
7 312,78
10 727,43
12 214,15
2. Capital cost
/
Kapitaalkoste
1 005,61
1 063,27
849,59
1 430,18
Total cost per hectare
/
Totale koste per hektaar
6 477,67
8 376,05
11 577,01
13 644,33
Yield
/
Opbrengs (t/ha)
3,98
6,84
7,00
8,00
Income
/
Inkomste
Producer price
/
Produsenteprys (R/ton)
2 188,46
1 599,00
2 045,00
1 902,00
Producer price
/
Produsenteprys (R/ha)
8 710,07
10 937,16
14 315,00
15 216,00
Profit/Loss per ha
/
Wins/Verlies per ha
2 232,40
2 561,11
2 737,99
1 571,67
Actual income and production cost figures for dry land maize (2016/2017 year)
Werklike inkomste en produksiekostesyfers vir droëlandmielies (2016/2017-jaar)
1
Inset- en produksie-oorsig
Input and production overview
Produksiekoste-oorsig
Overview of production costs