


 105 / 143

103
8
7
6
5
4
3
2
1
0
9
8
7
6
5
4
3
2
1
0
t/ha
t/ha
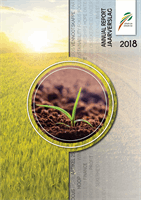
Actual production cost, yield and profit/loss of maize for the Eastern Free State
Werklike produksiekoste, opbrengs en wins/verlies van mielies in die Oos-Vrystaat
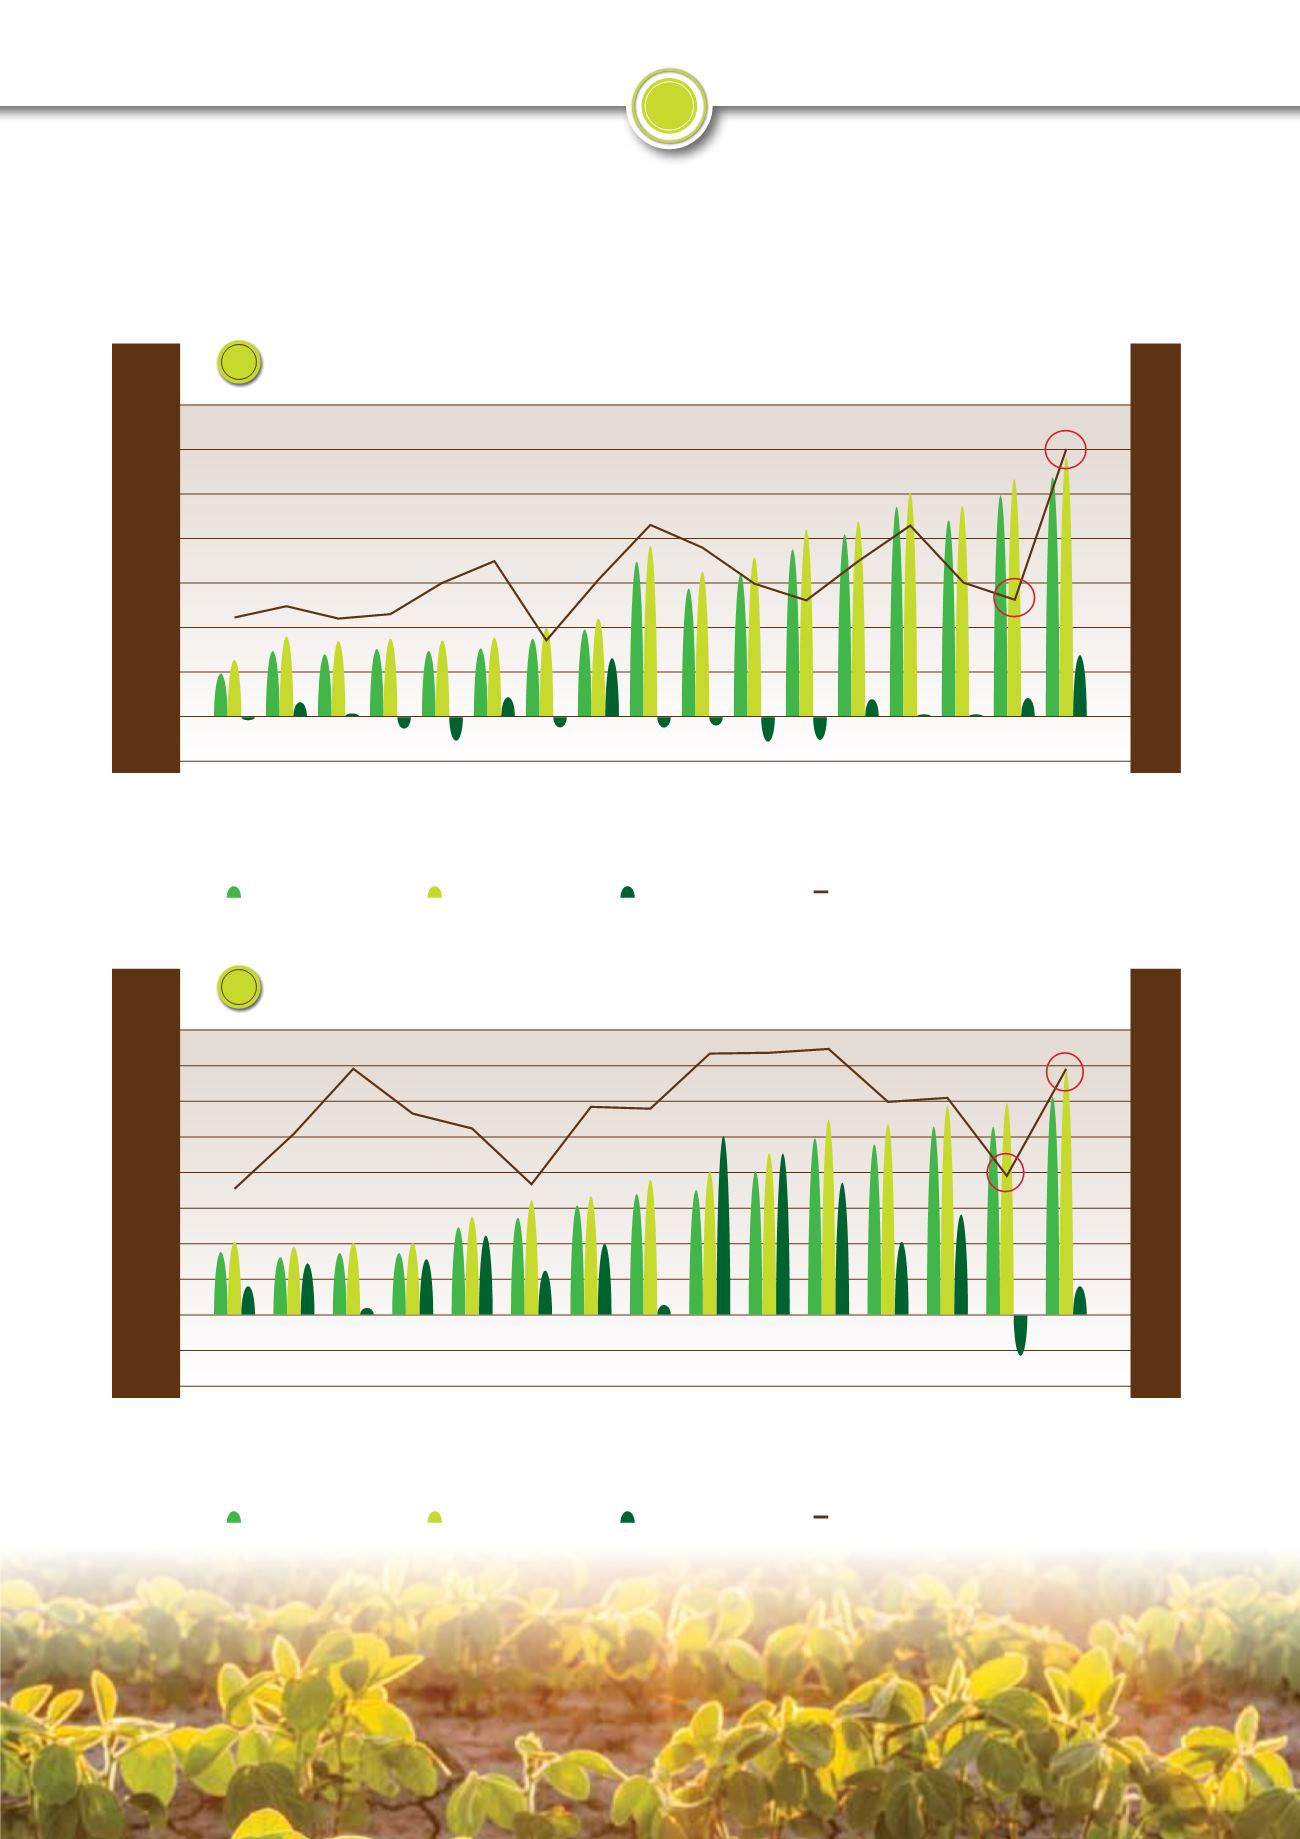
Actual production cost, yield and profit/loss of maize for KwaZulu-Natal
Werklike produksiekoste, opbrengs en wins/verlies van mielies in KwaZulu-Natal
2000/2001
2001/2002
2002/2003
2003/2004
2004/2005
2005/2006
2006/2007
2007/2008
2008/2009
2009/2010
2010/2011
2011/2012
2012/2013
2013/2014
2014/2015
2015/2016
2016/2017
2002/2003
2003/2004
2004/2005
2005/2006
2006/2007
2007/2008
2008/2009
2009/2010
2010/2011
2011/2012
2012/2013
2013/2014
2014/2015
2015/2016
2016/2017
Total variable cost
Totaal lopende koste
Total variable cost
Totaal lopende koste
Total cost per ha
Totale koste per ha
Total cost per ha
Totale koste per ha
Profit/loss per ha
Wins/verlies per ha
Profit/loss per ha
Wins/verlies per ha
Yield (t/ha)
Opbrengs (t/ha)
Yield (t/ha)
Opbrengs (t/ha)
3
4
Grafiek 1 toon duidelik dat Noordwes uiters uitdagende produksie
toestande ervaar het, aangesien swak opbrengste gedurende die
2012/2013-, 2014/2015- en 2015/2016-seisoen behaal is. Hierdie
streek het oor die algemeen uiters uitdagende toestande ervaar, wat
druk op winsgewende mielieproduksie geplaas het.
16 000
14 000
12 000
10 000
8 000
6 000
4 000
2 000
0
-2 000
-4 000
R/ha
R/ha
Source: Grain SA
Bron: Graan SA
Source: Grain SA
Bron: Graan SA
Graph 1 clearly indicates that the North West Province experienced
very challenging production conditions, as poor yields were achieved
during the 2012/2013, 2014/2015 and 2015/2016 seasons. This region
in general experienced very challenging conditions, putting pressure
on profitable maize production.
Inset- en produksie-oorsig
Input and production overview
Produksiekoste-oorsig
Overview of production costs
14 000
12 000
10 000
8 000
6 000
4 000
2 000
0
-2 000