


 106 / 143

104
Jaarverslag 2018
annual report 2018
Bydrae van verskillende veranderlike-insetkoste-items
tot die totale veranderlike insetkoste van mielies
Die belangrikste fokus van hierdie afdeling is op die veranderlike
koste wat by die produksie van mielies betrokke is – en veral op die
uitdrukking van die verskillende veranderlike-insetkoste-items as ’n
persentasie van die totale veranderlike insetkoste.
Grafiek 5a en 5b
toon die gemiddelde persentasiebydrae van geselekteerde verander-
like insetkoste tot mielieproduksie in die Noordwes-Vrystaat tydens
twee verskillende seisoene. Kunsmis en kalk, wat die grootste bydraende
insette vir ’n mielieprodusent is, het in die 2010/2011-seisoen ’n bere
kende 30% bygedra, en dit het in die ses seisoene later tot 33,6% van
die totale veranderlike insetkoste toegeneem.
Brandstof het in die 2010/2011-seisoen 13% tot die veranderlike
insetkoste bygedra. Die daling in brandstofgebruik is duidelik, aangesien
die jongste inligting ’n bydrae van 10,3% aandui. Dit is die gevolg van
die verandering in produsente se produksiepraktyke. Herstelwerk en
onderdele het 9,0% bygedra en ’n dalende tendens ten opsigte van die
relatiewe bydrae tot die totale veranderlike insetkoste getoon. Saadkoste
het ’n styging in die relatiewe bydrae tot die totale veranderlike insetkoste
getoon, terwyl die koste vir chemiese beheer ook vanaf 7% van die totale
veranderlike insetkoste in 2010/2011 tot 9,7% in 2016/2017 gestyg het.
Dit illustreer die tipe langtermyninligting wat met behulp van hierdie projek
ingesamel word.
Begrote inkomste- en produksiekostesyfers
vir mielies (2018/2019-produksieseisoen)
Die mieliebegrotings en hulle prestasie teen dié van ander gewasse
word in
Tabel 2
en
Tabel 3
getoon. Die opbrengsscenario’s is gegrond op
aannames vir produksietoestande in die westelike streke (Tabel 2) en die
oostelike streke (Tabel 3 op bladsy 107). Hierdie tabelle word saamgestel
om ’n aanduiding te gee van die verskil in winsgewendheid tussen die
onderskeie somergewasse, maar dit is belangrik om daarop te let dat
hierdie syfers van produsent tot produsent kan verskil.
Contribution of different variable input cost items
to the total variable input cost of maize
The main focus of this section is on the variable costs to produce
maize and, specifically, to express different variable input cost items as a
percentage of the total variable input costs.
Graph 5a and 5b
shows the
average percentage contribution of selected variable input costs during
two different seasons for maize production in the North Western Free
State. Fertiliser and lime, which are the biggest contributing input for
a maize producer, contributed a calculated 30% during the 2010/2011
season and increased to 33,6% to the total variable input cost six
seasons later.
Fuel contributed 13% to the total variable input cost during the
2010/2011 season. The decrease in fuel usage is evident as the
latest information indicates a contribution of 10,3%. This is due
to the change in producers’ production practices. Repairs and
parts contributed 9,0% and showed a declining trend in terms of
its relative contribution to the total variable input cost. Seed cost
showed an increase in its relative contribution to the total variable
input cost, while the cost for chemical control also increased from
7% during 2010/2011 to 9,7% of the total variable input cost in
2016/2017. This illustrates the type of long-term information that
is gathered by means of this project.
Budgeted income and production cost figures
for maize (2018/2019 production season)
An illustration of the maize budgets and their performance against
other crops is shown in
Table 2
and
Table 3
. The yield scenarios
were based on assumptions for production conditions in the western
regions (Table 2) and the eastern regions (Table 3 on page 107).
These tables are compiled to give an indication of the difference in
profitability between the various summer crops, but it is important to
note that these figures may vary from producer to producer.
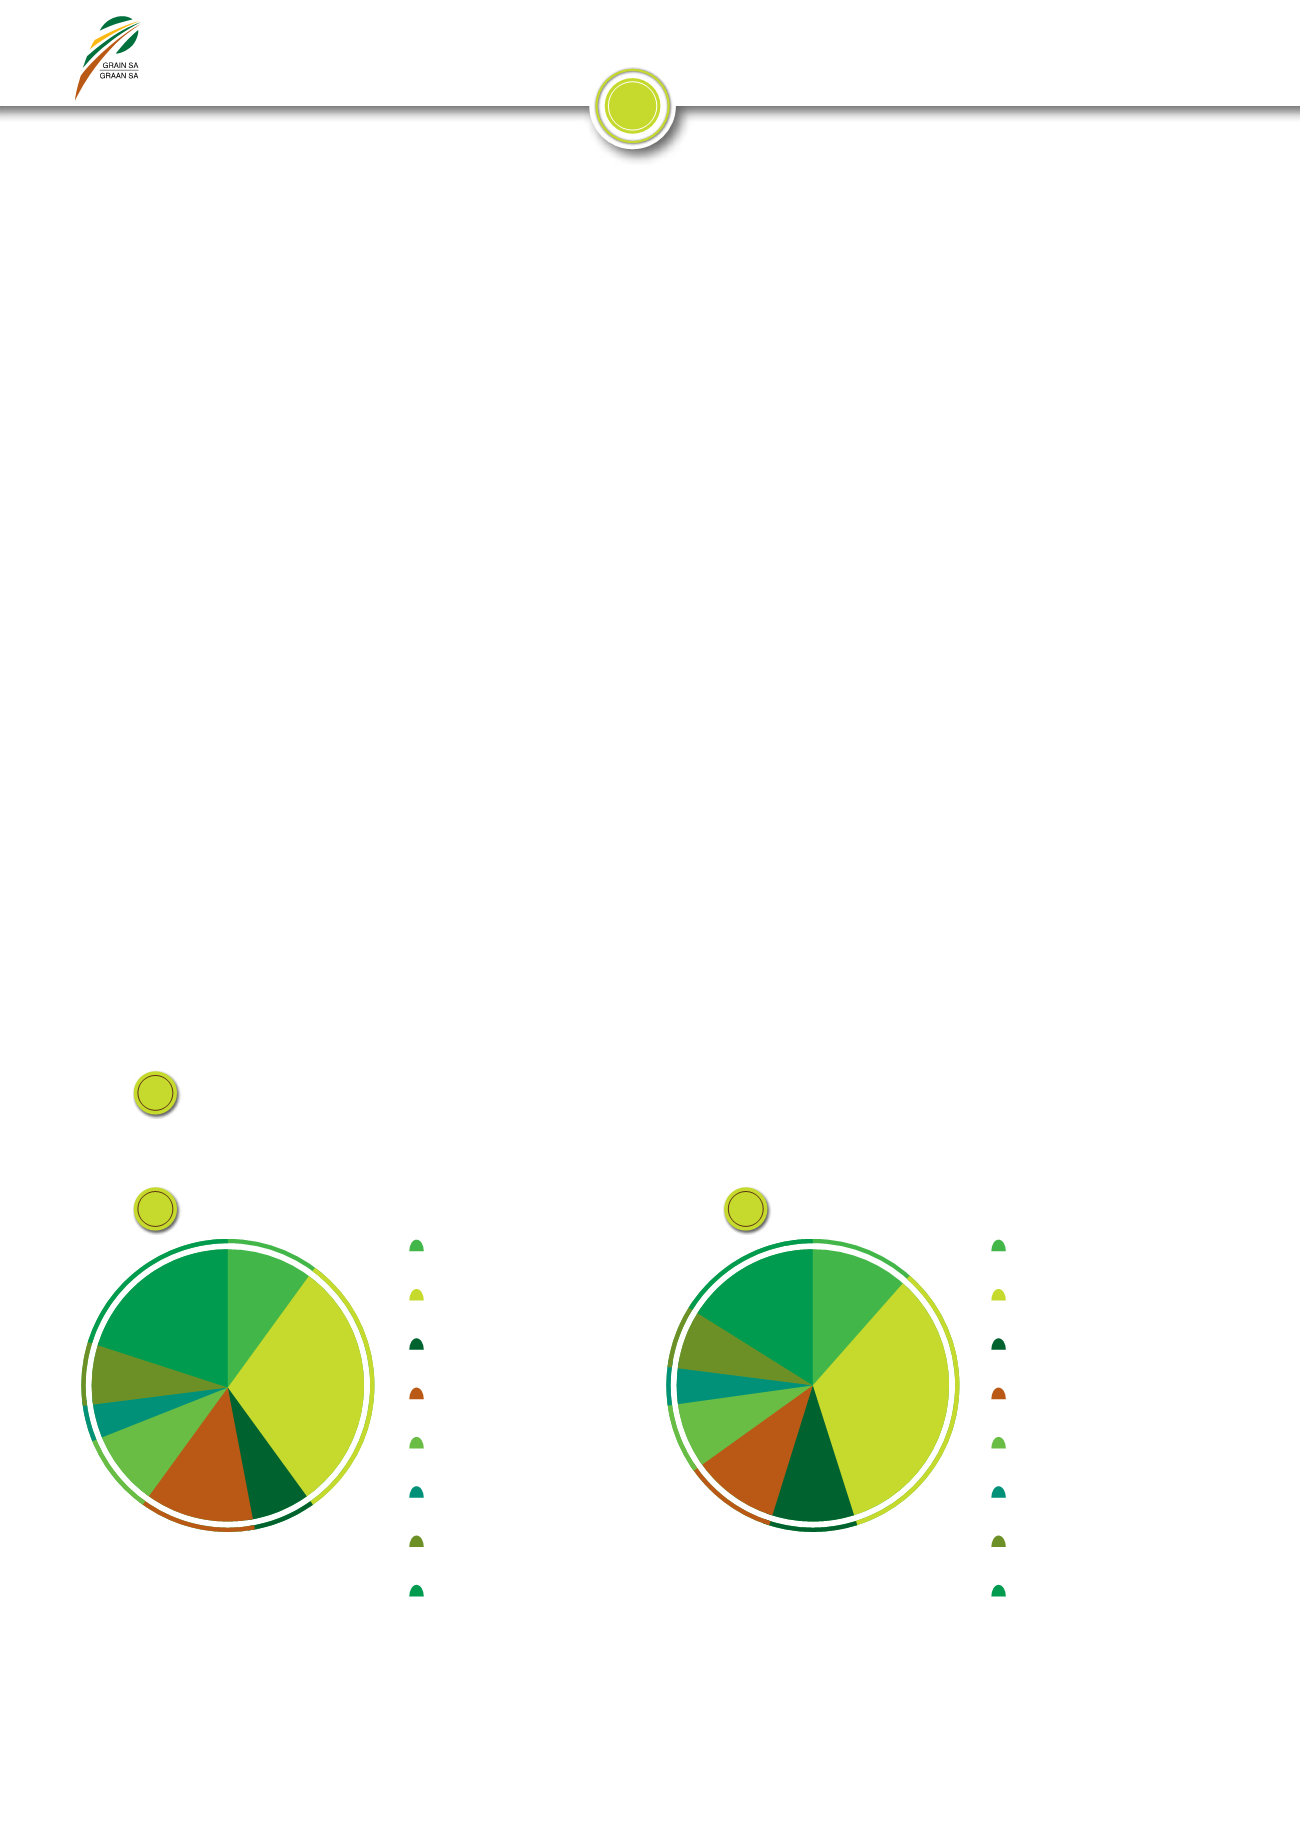
a and b: Contribution of different variable input cost items to the total variable input cost of maize
for the North Western Free State
a en b: Bydrae van verskillende veranderlike insetkoste-items tot die totale veranderlike insetkoste
van mielies in die Noordwes-Vrystaat
Seed
Saad
Seed
Saad
Fertiliser and lime
Kunsmis en kalk
Fertiliser and lime
Kunsmis en kalk
Chemical control
Chemiese beheer
Chemical control
Chemiese beheer
Fuel
Brandstof
Fuel
Brandstof
Repairs and parts
Herstel en onderdele
Repairs and parts
Herstel en onderdele
Permanent labour
Permanente arbeid
Permanent labour
Permanente arbeid
Interest on production credit
Rente op produksiekoste
Interest on production credit
Rente op produksiekoste
Other cost
Ander koste
Other cost
Ander koste
5
9%
11,6%
30%
33,6%
7%
9,7%
13%
10,3%
9%
7,7%
4%
4,2%
7%
6,9%
20%
16,1%
2010/2011 production season
2010/2011-produksieseisoen
2016/2017 production season
2016/2017-produksieseisoen
a
b