


 69 / 116

67
2 000
1 800
1 600
1 400
1 200
1 000
800
600
400
200
0
Index
Indeks
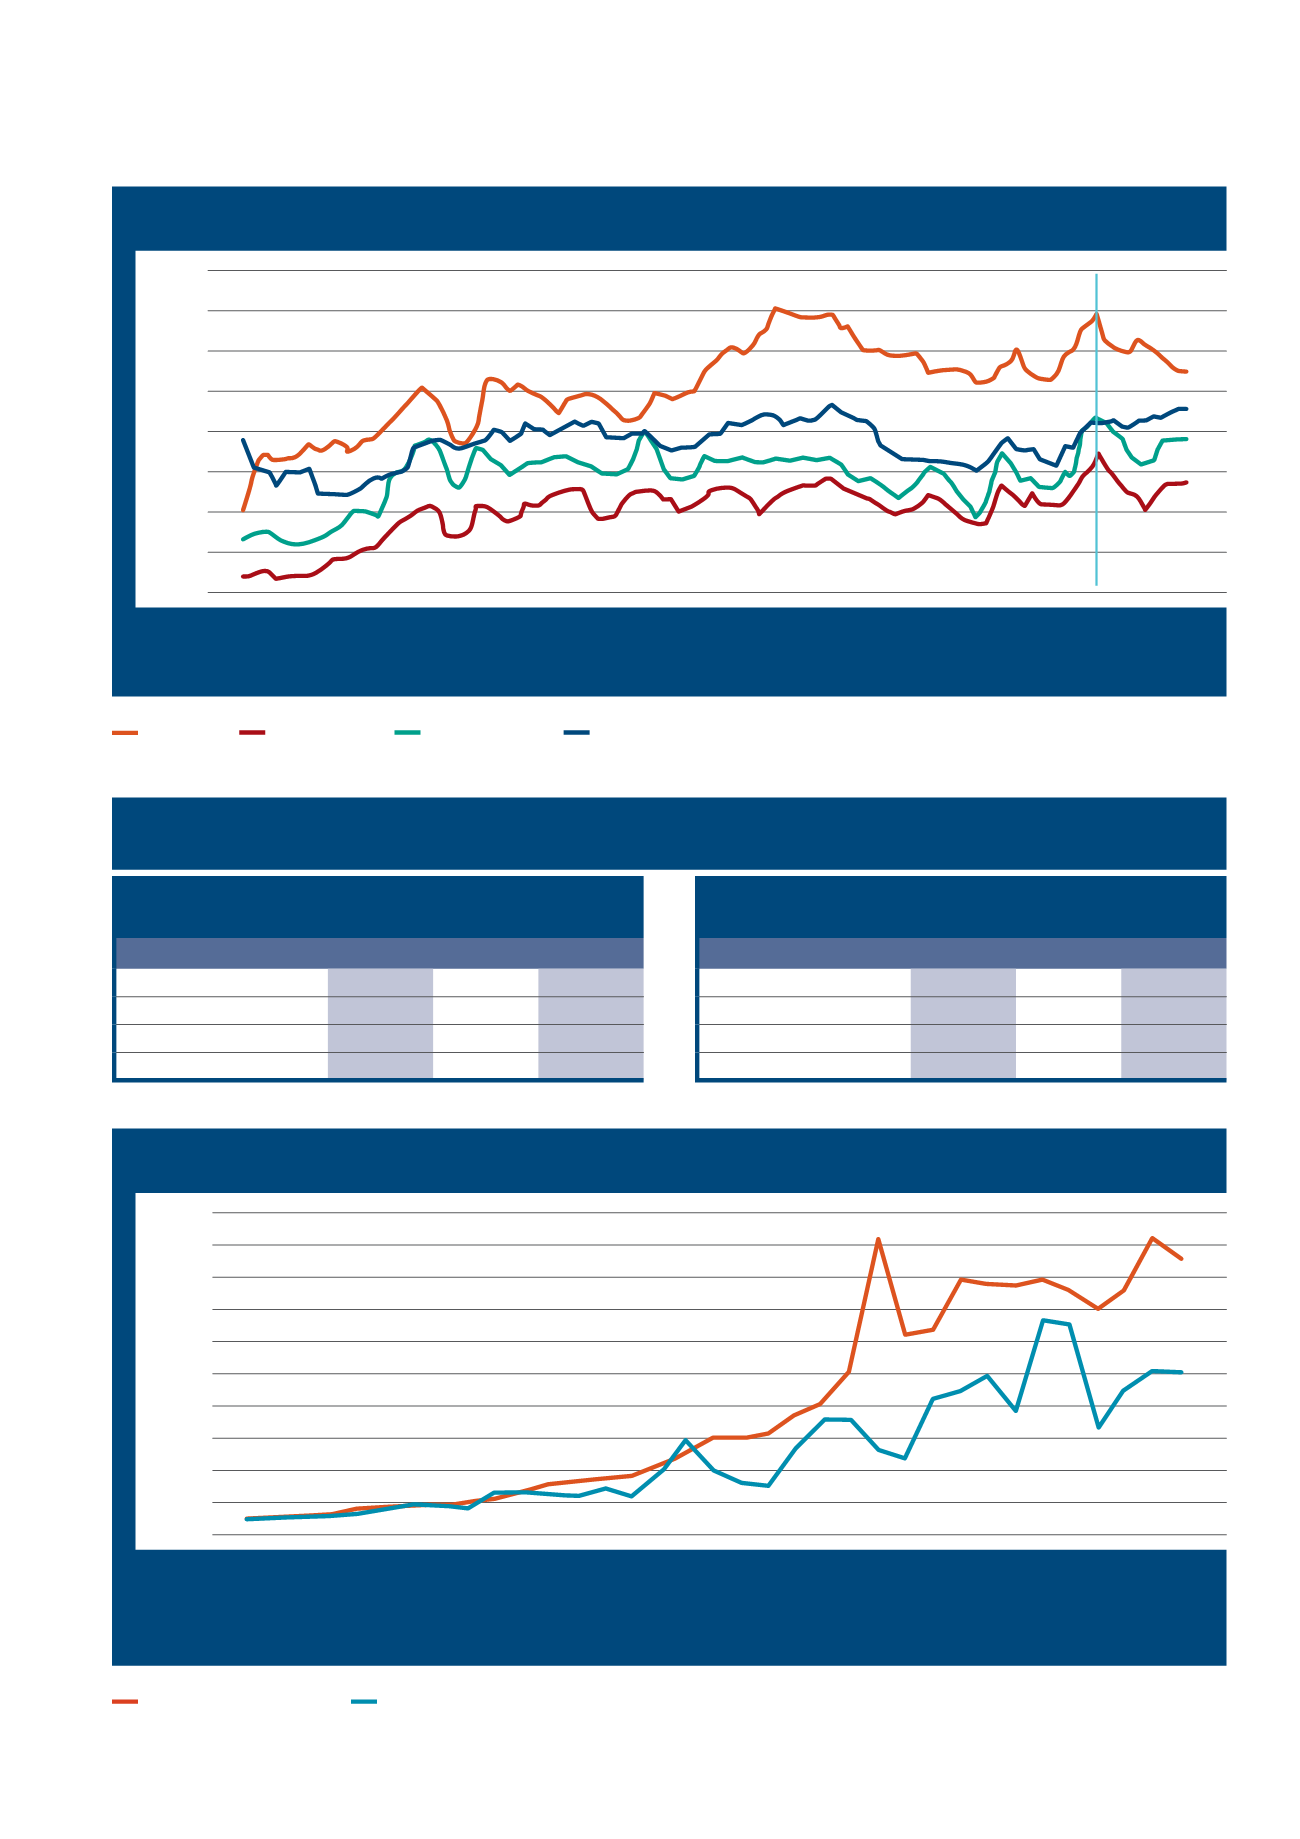
GRAPH 4 – Indices of the producer price of maize and the prices of fertiliser.
GRAFIEK 4 – Indeks van die produsenteprys van mielies en die prys van kunsmis.
1985/1986
1986/1987
1987/1988
1988/1989
1989/1990
1990/1991
1991/1992
1992/1993
1993/1994
1994/1995
1995/1996
1996/1997
1997/1998
1998/1999
1999/2000
2000/2001
2001/2002
2002/2003
2003/2004
2004/2005
2005/2006
2006/2007
2007/2008
2008/2009
2009/2010
2010/2011
2011/2012
2012/2013
2013/2014
2014/2015
2015/2016
2016/2017
2017/2018
2018/2019
2019/2020*
Fertiliser price index
Kunsmisprysindeks
Maize price index
Mielieprysindeks
* Preliminary/Voorlopig
Source: Grain SA
Bron: Graan SA
TABLE 3 – Local fertiliser prices.
TABEL 3 – Plaaslike kunsmispryse.
OCTOBER
2018
OCTOBER
2019 % CHANGE
Fertiliser
R/ton
R/ton
%
LAN (28)
6 037
5 915
-2,0
Urea (46)
7 134
6 782
-4,9
MAP
9 730
8 512
-12,5
KCL
7 270
7 569
+4,1
OKTOBER
2018
OKTOBER
2019
% VERAN-
DERING
Kunsmis
R/ton
R/ton
%
KAN (28)
6 037
5 915
-2,0
Ureum (46)
7 134
6 782
-4,9
MAP
9 730
8 512
-12,5
KCI
7 270
7 569
+4,1
Indices/Indekse:
1985/1986 = 100
11 000
10 000
9 000
8 000
7 000
6 000
5 000
4 000
3 000
R/ton
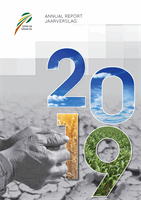
GRAPH 3 – Local fertiliser prices.
GRAFIEK 3 – Plaaslike kunsmispryse.
01/2010
04/2010
07/2010
10/2010
01/2011
04/2011
07/2011
10/2011
01/2012
04/2012
07/2012
10/2012
01/2013
04/2013
07/2013
10/2013
01/2014
04/2014
07/2014
10/2014
01/2015
04/2015
07/2015
10/2015
01/2016
04/2016
07/2016
10/2016
01/2017
04/2017
07/2017
10/2017
01/2018
04/2018
07/2018
10/2018
01/2019
04/2019
07/2019
10/2019
MAP
LAN (28)
KAN (28)
Urea (46)
Ureum (46)
Potassium chloride (granular)
Kaliumchloried (grof)
Source: Grain SA
Bron: Graan SA