


 96 / 138

92
INPUT AND PRODUCTION OVERVIEW
Fertiliser
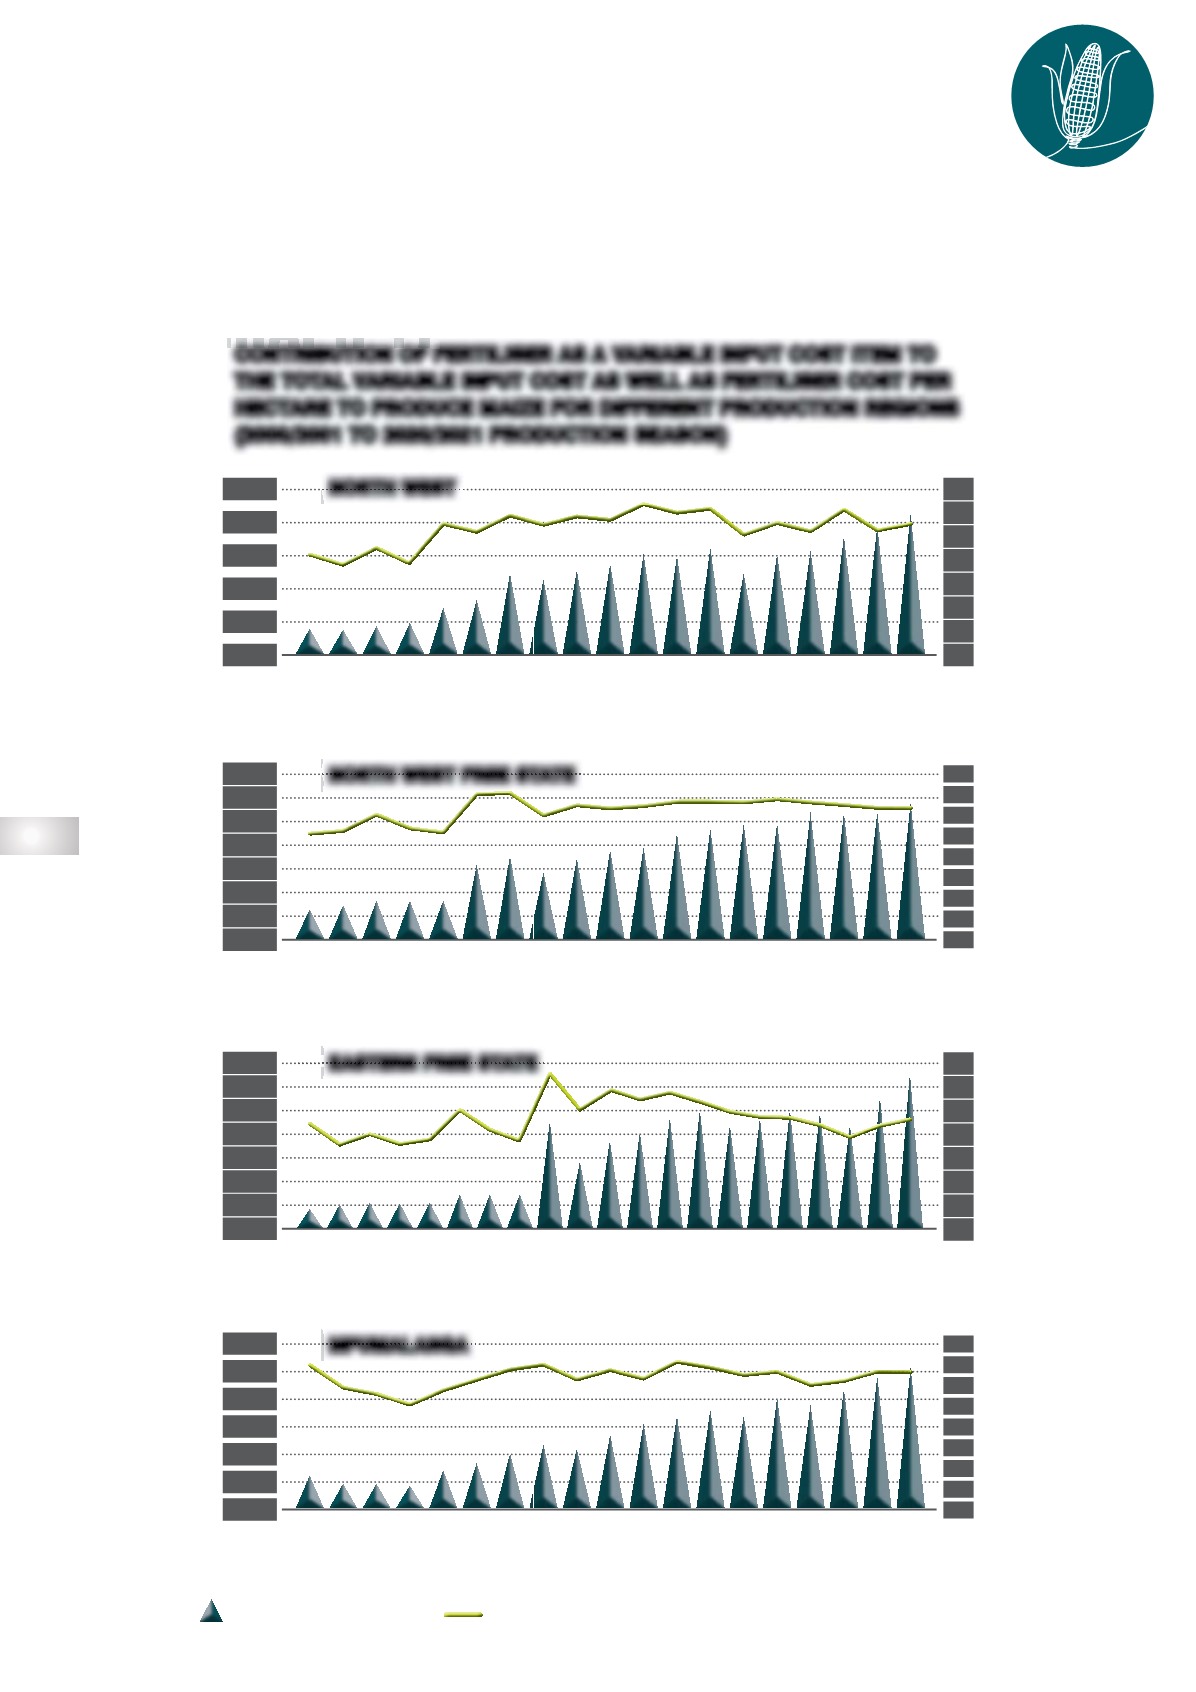
Fertiliser as production input contributes between 25% and 35% on average to a maize producer’s
variable production costs, depending on the region.
Graph 17
focuses on the long-term average
percentage contribution of fertiliser as a variable input cost for maize for the different regions
(North-west Free State, North West, Eastern Free State and Mpumalanga).
GRAPH 17
CONTRIBUTION OF FERTILISER AS A VARIABLE INPUT COST ITEM TO
THE TOTAL VARIABLE INPUT COST AS WELL AS FERTILISER COST PER
HECTARE TO PRODUCE MAIZE FOR DIFFERENT PRODUCTION REGIONS
(2000/2001 TO 2020/2021 PRODUCTION SEASON)
FERTILISER AND LIME
FERTILISER AS % OF TOTAL VARIABLE COST
A
2002/2003
2003/2004
2004/2005
2005/2006
2006/2007
2007/2008
2008/2009
2009/2010
2010/2011
2011/2012
2012/2013
2013/2014
2014/2015
2015/2016
2016/2017
2017/2018
2018/2019
2019/2020
2020/2021
2 500
2 000
1 500
1 000
500
0
35
30
25
20
15
10
5
0
35
30
25
20
15
10
5
0
R/ha
%
NORTH WEST
B
2002/2003
2003/2004
2004/2005
2005/2006
2006/2007
2007/2008
2008/2009
2009/2010
2010/2011
2011/2012
2012/2013
2013/2014
2014/2015
2015/2016
2016/2017
2017/2018
2018/2019
2019/2020
2020/2021
3 500
3 000
2 500
2 000
1 500
1 000
500
0
40
35
30
25
20
15
10
5
0
R/ha
%
NORTH WEST FREE STATE
C
2000/2001
2001/2002
2002/2003
2003/2004
2004/2005
2005/2006
2006/2007
2007/2008
2008/2009
2009/2010
2010/2011
2011/2012
2012/2013
2013/2014
2014/2015
2015/2016
2016/2017
2017/2018
2018/2019
2019/2020
2020/2021
3 500
3 000
2 500
2 000
1 500
1 000
500
0
R/ha
%
EASTERN FREE STATE
D
2002/2003
2003/2004
2004/2005
2005/2006
2006/2007
2007/2008
2008/2009
2009/2010
2010/2011
2011/2012
2012/2013
2013/2014
2014/2015
2015/2016
2016/2017
2017/2018
2018/2019
2019/2020
2020/2021
6 000
5 000
4 000
3 000
2 000
1 000
0
40
35
30
25
20
15
10
5
0
R/ha
%
MPUMALANGA