


 100 / 138

96
INPUT AND PRODUCTION OVERVIEW
Eastern parts of the country
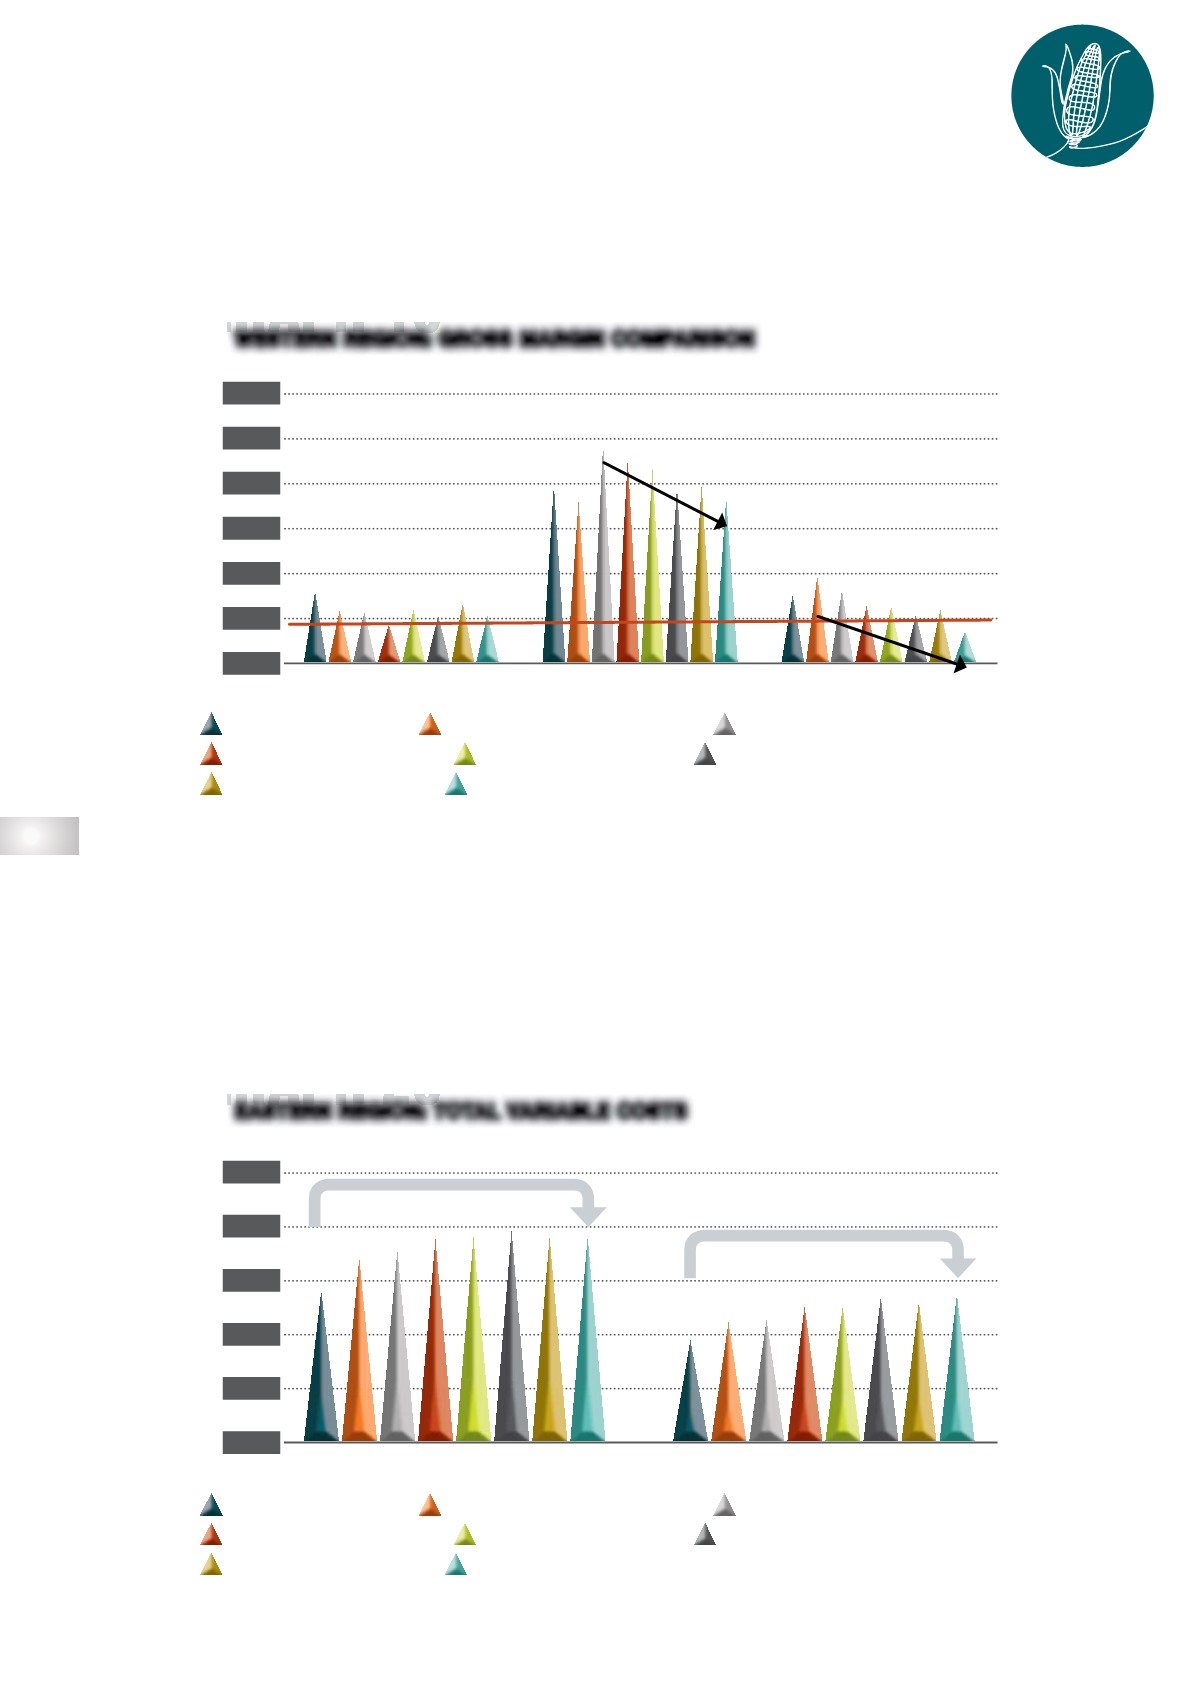
Graph 20
shows the estimated total monthly variable costs for Mpumalanga, with the first scenario
compiled in the 2021/2022 production season and estimated production cost figures for the
2022/2023 production season, as compiled with input costs as available in August 2022. The total
variable costs for maize (average yield) increased from R14 100/ha (as determined for the 2021/2022
production season) to R19 040/ha (August 2022). This is a drastic increase of 34%, of which fer-
tiliser is the biggest contributing factor. According to further calculations, during the same period
the total variable costs of soybeans increased by an average of 42%.
GRAPH 19
WESTERN REGION: GROSS MARGIN COMPARISON
MAIZE
SUNFLOWER
SOYBEANS
12 000
10 000
8 000
6 000
4 000
2 000
0
R/ha
During the determination of gross margins, only variable costs were considered and therefore
fixed costs are excluded. In
Graph 19
, a red line can be observed indicating a fixed cost amount
of R2 500. If the bar is lower than the red line, it is an indication that producers cannot cover their
total costs (variable + fixed costs). Sunflower production in North West seems to be more profitable
when compared to maize and soybeans.
GRAPH 20
EASTERN REGION: TOTAL VARIABLE COSTS
MAIZE
SOYBEANS
25 000
20 000
15 000
10 000
5 000
0
R/ha
+34%
+42%
2021/2022 SEASON
2021/2022 SEASON
2022/2023 (APRIL 2022)
2022/2023 (APRIL 2022)
2022/2023 (JULY 2022)
2022/2023 (JULY 2022)
2022/2023 (MARCH 2022)
2022/2023 (MARCH 2022)
2022/2023 (JUNE 2022)
2022/2023 (JUNE 2022)
2022/2023 (FEBRUARY 2022)
2022/2023 (FEBRUARY 2022)
2022/2023 (MAY 2022)
2022/2023 (MAY 2022)
2022/2023 (AUGUST 2022)
2022/2023 (AUGUST 2022)