


 102 / 138

98
INPUT AND PRODUCTION OVERVIEW
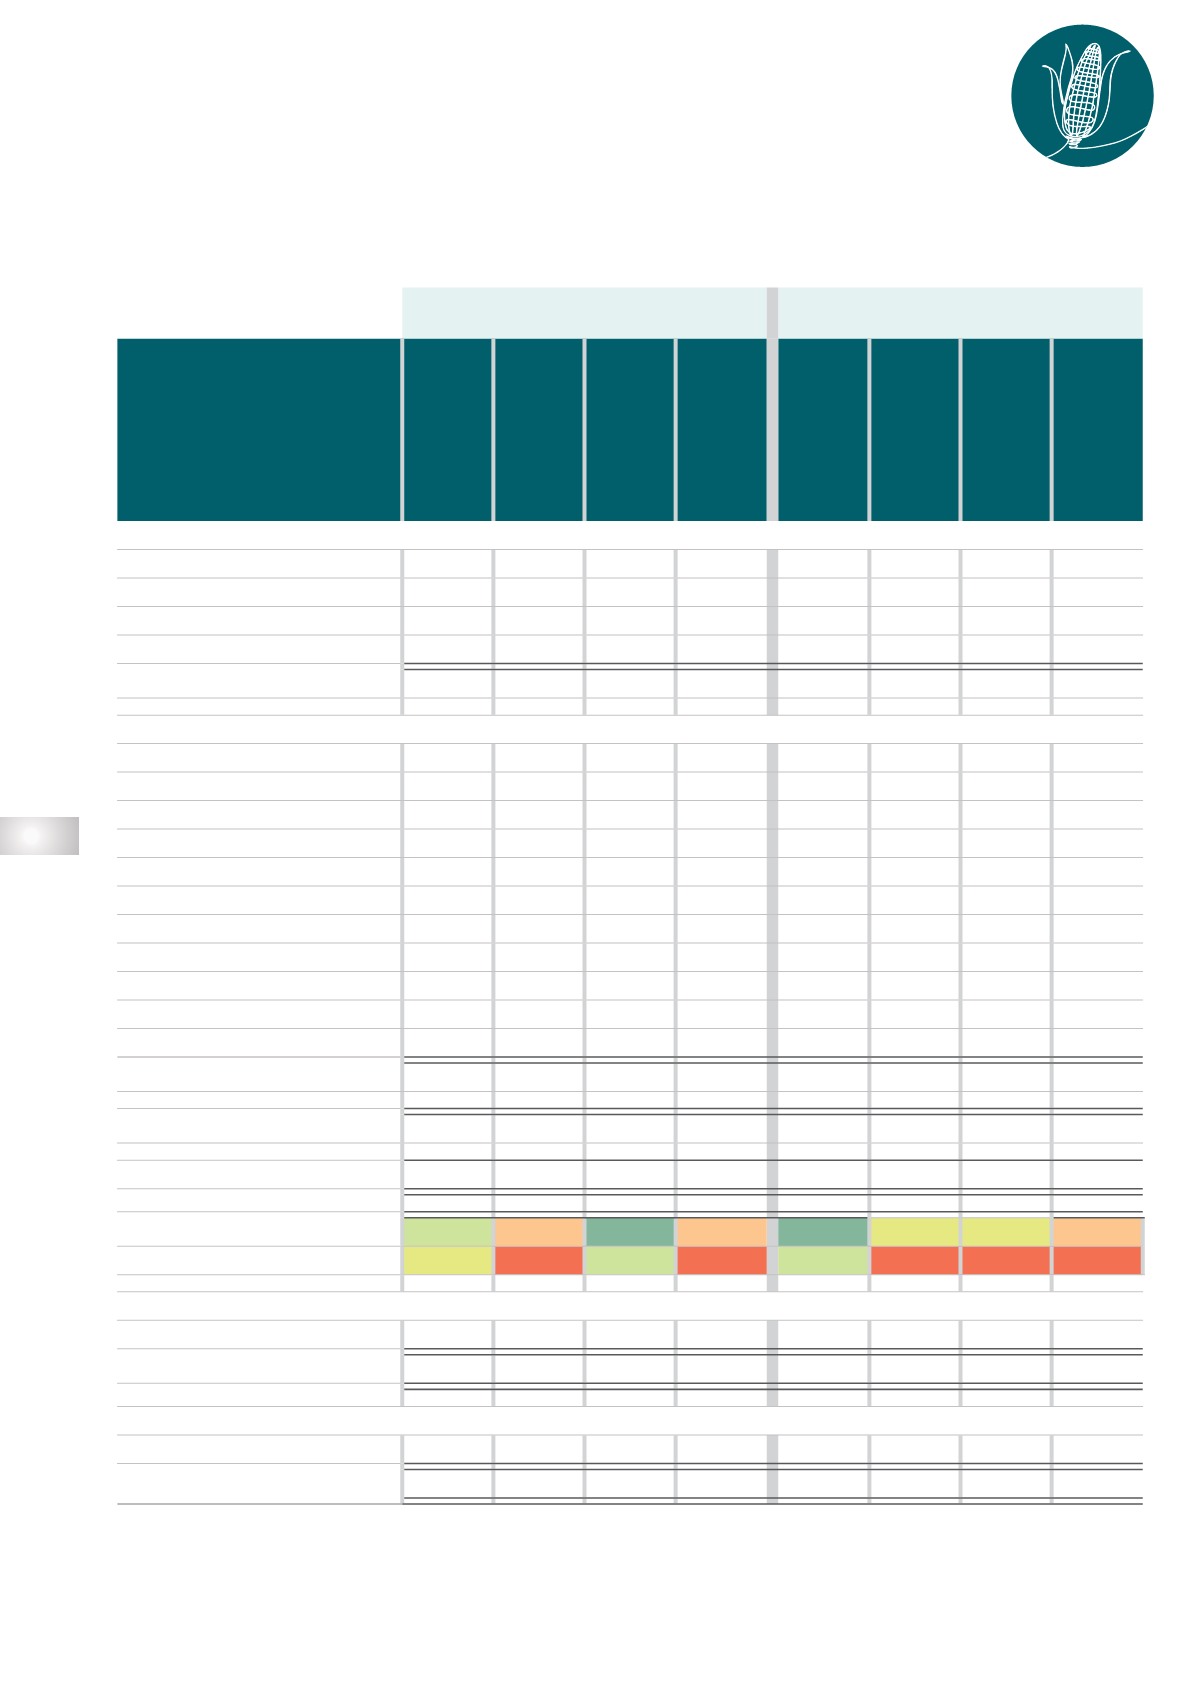
North West
North-west and Central Free State
MAIZE
(HIGHER YIELD)
MAIZE
SUNFLOWER
SOYBEANS
MAIZE
(HIGHER YIELD)
MAIZE
SUNFLOWER
SOYBEANS
1. INCOME
Planned yield (t/ha)
6,00
4,00
1,50
1,25
6,50
4,50
1,50
1,75
Safex price (best grade) (R/ton)
R4 100 R4 100 R10 000 R8 500 R4 100 R4 100 R10 000 R8 500
Deductions (R/ton)
R304
R304
R339
R182
R296
R340
R412
R132
Producer price (R/ton)
R3 796 R3 796 R9 661 R8 318 R3 804 R3 760 R9 588 R8 368
Gross income (R/ha)
R22 776 R15 184 R14 492 R10 398 R24 726 R16 920 R14 382 R14 644
2. VARIABLE COSTS
Seed
R1 841
R1 446
R658
R1 145
R1 457
R1 300
R507
R920
Fertiliser
R7 590 R5 060
R2 509
R2 788
R4 633
R3 207
R1 898
R1 423
Lime
R203
R203
R203
R203
R163
R163
R163
R163
Fuel
R1 912
R1 800
R1 506
R1 250
R1 082
R1 122
R1 130
R1 048
Repairs
R727
R711
R618
R618
R806
R790
R682
R763
Herbicides
R1 218
R1 218
R481
R1 236
R855
R796
R568
R793
Pesticide
R748
R748
R96
R192
R226
R115
R253
R336
Input insurance
R1 025
R683
R283
R203
R356
R247
R259
R240
Grain price hedging
R836
R646
R186
R201
R1 113
R895
R522
R675
Crop insurance
R597
R398
R290
R728
R510
R371
R512
R1 109
Production credit interest
R751
R581
R307
R385
R476
R383
R263
R 317
Total variable cost (R/ha)
R17 447 R13 495 R7 136 R8 948
R11 677 R9 388 R6 756 R7 788
Total fixed cost (R/ha)
R2 552 R2 552 R2 355 R2 407 R2 572 R2 457 R2 356 R2 179
Total cost (R/ha)
R19 999 R16 046 R9 491 R11 356
R14 249 R11 845 R9 113 R9 967
3. GROSS MARGIN (R/ha)
R5 329 R1 689 R7 355 R1 449 R13 049 R7 532 R7 626 R6 856
4. NET MARGIN (R/ha)
R2 777 -R862 R5 000 -R958 R10 477 R5 075 R5 269 R4 677
Break-even (only variable costs)
Yield (t/ha)
4,60
3,55
0,74
1,08
3,07
2,50
0,70
0,93
Safex price (R/ha)
3 212 3 678 5 097 7 341
2 093 2 426 4 916 4 582
Break-even (variable + fixed costs)
Yield (t/ha)
5,27
4,23
0,98
1,37
3,75
3,15
0,95
1,19
Safex price (R/ha)
3 637 4 316 6 666 9 266
2 488 2 972 6 487 5 828
TABLE 8
COMPARISON OF PRODUCTION COST BUDGETS FOR SUMMER GRAIN
FOR THE 2022/2023 SEASON (WESTERN REGION)