
97
INPUT AND PRODUCTION OVERVIEW
During the determination of gross margins, only variable costs were considered and therefore fixed
costs are excluded. In
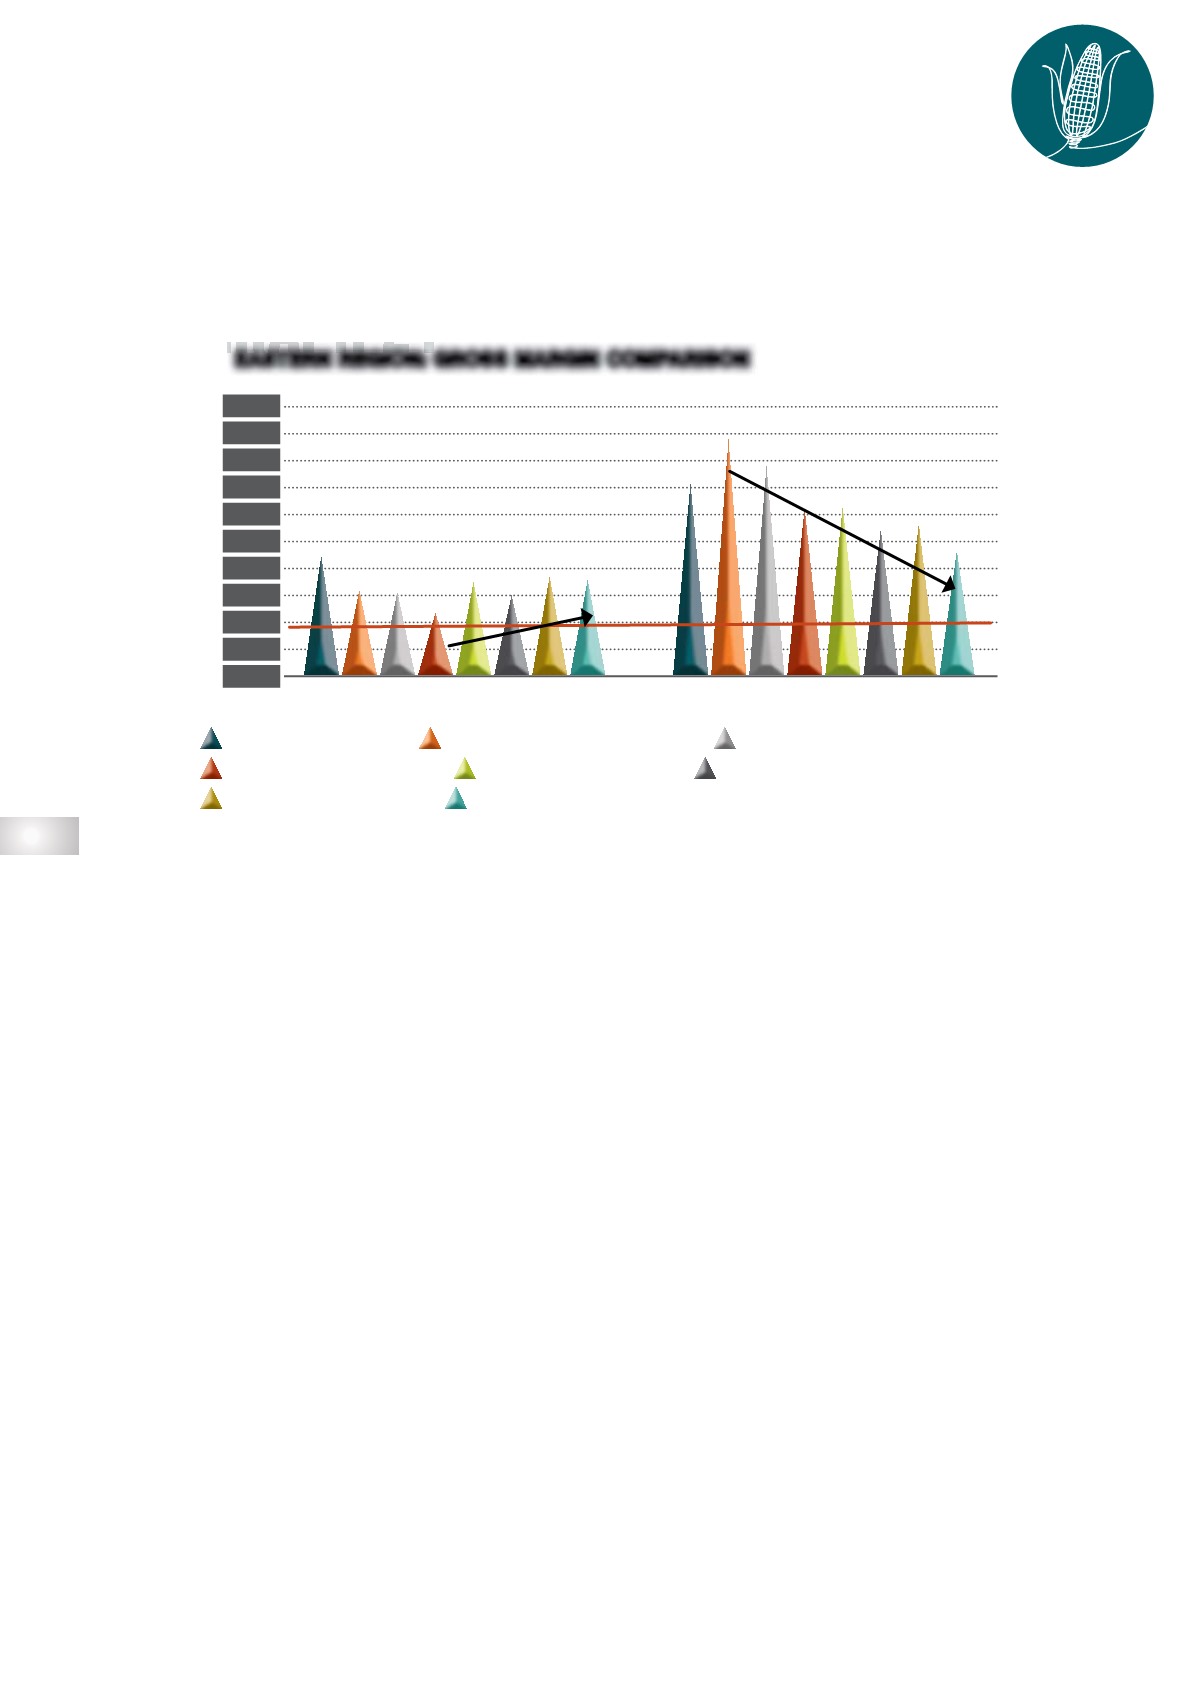
Graph 21
, a red line can be observed indicating a fixed cost amount of R2 500.
If the bar is lower than the red line, this is an indication that producers cannot cover their total costs
(variable + fixed costs). Oilseed prices are currently trading at high levels, which makes the profitability
situation for soybeans more favourable when compared with maize.
Profitability calculation for 2022/2023
Grain SA is in the process of finalising the budgets for the 2022/2023 season. An illustration of the
maize budgets and their performance against other crops are shown in
Table 8
to
10
(on page 98 - 101).
The yield scenarios were based on assumptions for production conditions in different regions. These
tables are compiled to show an indication of the difference in profitability between the various summer
crops, but it is important to note that these figures may vary from producer to producer.
Western parts of the country
An example of the maize budgets and their performance against other crops is shown in
Table 8
(on page 98). The yield scenarios were based on assumptions for production conditions in the
western part of the country (North West and North-west and Central Free State). This figure is
compiled to show an indication of the difference in profitability between the various summer crops
(maize, sunflower, soybeans), but it is important to note that these figures may vary from producer
to producer.
While
Table 8
shows estimated production costs for North West and the North-west and Central
Free State,
Graph 22
(on page 99) again illustrates the gross and net margin situation.
The key fact is that sunflower (on paper) remains a stalwart crop for North West, although the
occurrence of diseases (specifically Sclerotinia) on sunflower has been affecting yields in the past
few seasons. According to calculations and if the Safex prices materialise, summer grain produc-
tion in the western parts of the country generally seems to be relatively profitable, excluding maize
that is planted on soils with a marginal yield potential when total input costs (fixed costs plus
variable costs) are taken into consideration.
GRAPH 21
EASTERN REGION: GROSS MARGIN COMPARISON
MAIZE
SOYBEANS
10 000
9 000
8 000
7 000
6 000
5 000
4 000
3 000
2 000
1 000
0
R/ha
2021/2022 SEASON
2022/2023 (APRIL 2022)
2022/2023 (JULY 2022)
2022/2023 (MARCH 2022)
2022/2023 (JUNE 2022)
2022/2023 (FEBRUARY 2022)
2022/2023 (MAY 2022)
2022/2023 (AUGUST 2022)


