


 95 / 138

91
INPUT AND PRODUCTION OVERVIEW
Seed
Graph 16
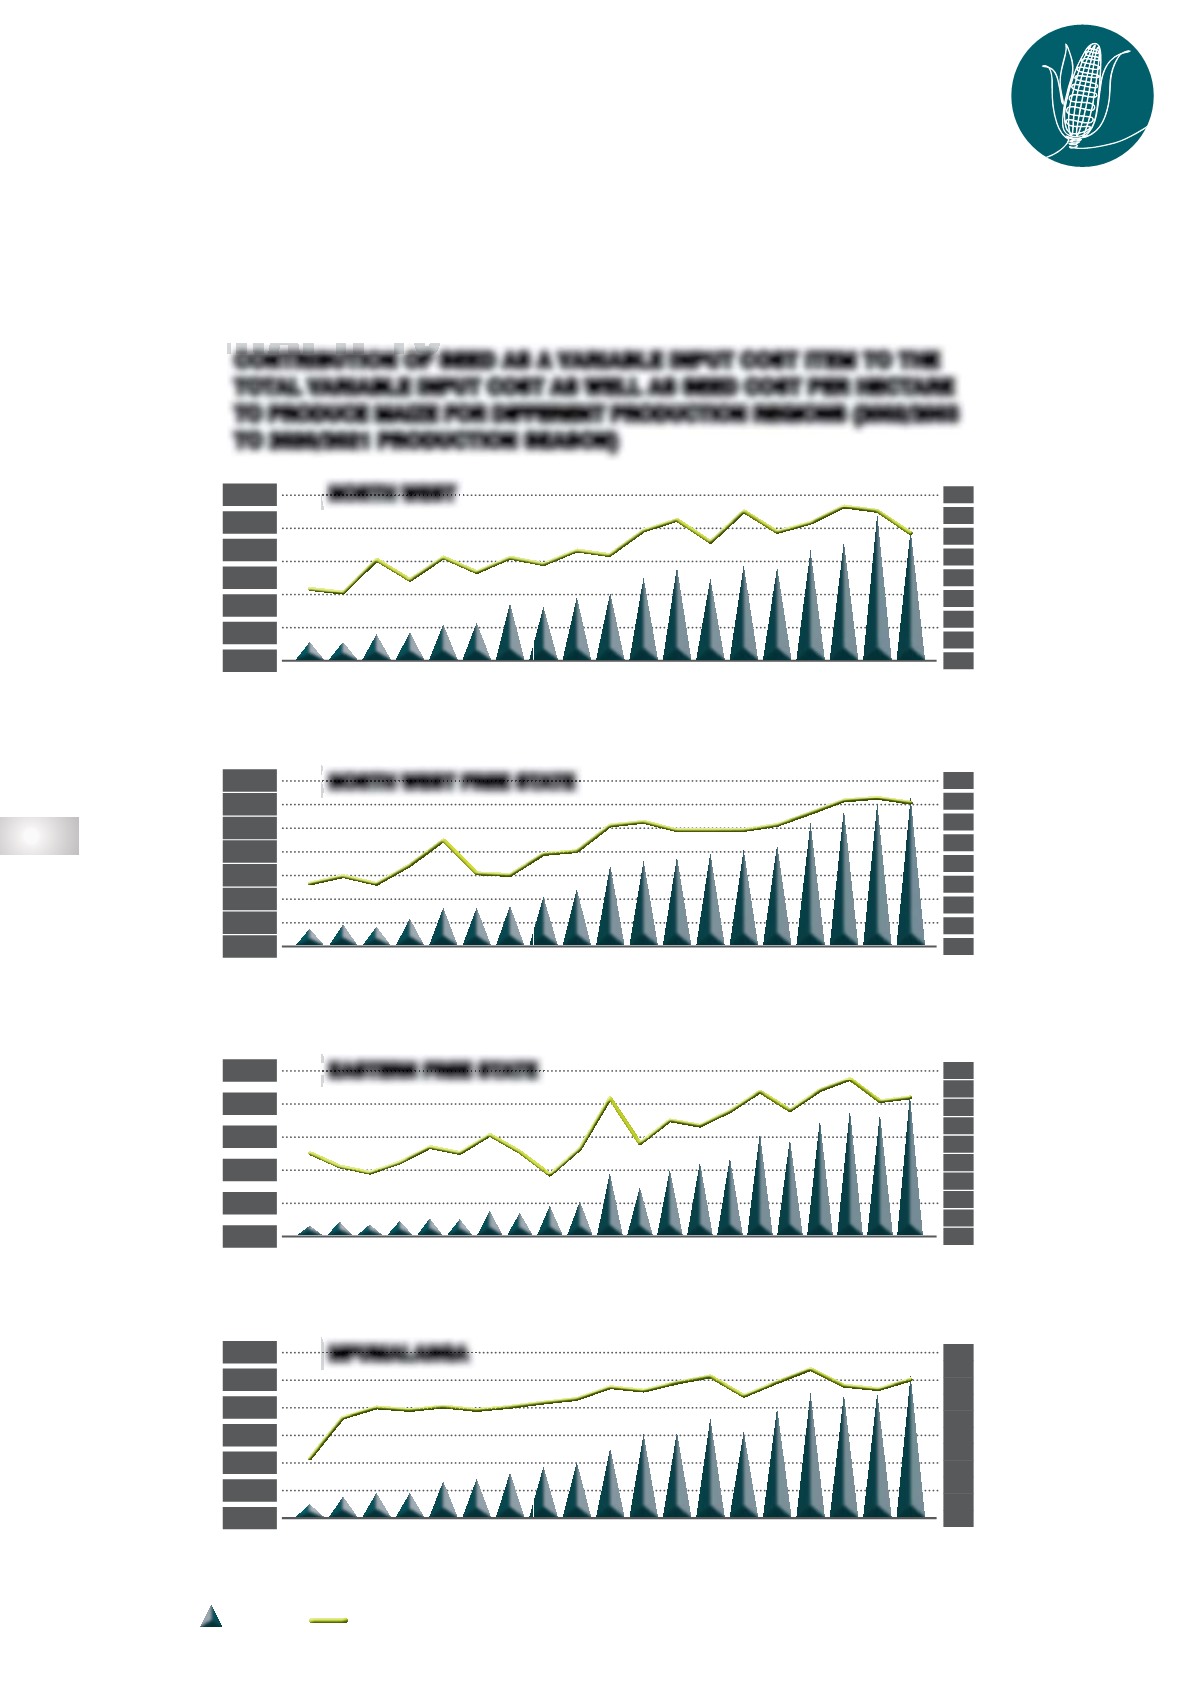
shows the long-term average percentage contribution of seed as a variable input cost for
maize for North West, the North-west Free State, the Eastern Free State and Mpumalanga. Except for
the percentage contribution of seed since 2000, the figure also highlights the increase in seed costs
per hectare during this 19-year period, for all four regions
GRAPH 16
CONTRIBUTION OF SEED AS A VARIABLE INPUT COST ITEM TO THE
TOTAL VARIABLE INPUT COST AS WELL AS SEED COST PER HECTARE
TO PRODUCE MAIZE FOR DIFFERENT PRODUCTION REGIONS (2002/2003
TO 2020/2021 PRODUCTION SEASON)
SEED
SEED AS % OF TOTAL VARIABLE COST
A
2002/2003
2003/2004
2004/2005
2005/2006
2006/2007
2007/2008
2008/2009
2009/2010
2010/2011
2011/2012
2012/2013
2013/2014
2014/2015
2015/2016
2016/2017
2017/2018
2018/2019
2019/2020
2020/2021
1 200
1 000
800
600
400
200
0
R/ha
%
NORTH WEST
B
2002/2003
2003/2004
2004/2005
2005/2006
2006/2007
2007/2008
2008/2009
2009/2010
2010/2011
2011/2012
2012/2013
2013/2014
2014/2015
2015/2016
2016/2017
2017/2018
2018/2019
2019/2020
2020/2021
1 400
1 200
1 000
800
600
400
200
0
16
14
12
10
8
6
4
2
0
16
14
12
10
8
6
4
2
0
R/ha
%
NORTH WEST FREE STATE
C
2000/2001
2001/2002
2002/2003
2003/2004
2004/2005
2005/2006
2006/2007
2007/2008
2008/2009
2009/2010
2010/2011
2011/2012
2012/2013
2013/2014
2014/2015
2015/2016
2016/2017
2017/2018
2018/2019
2019/2020
2020/2021
2 500
2 000
1 500
1 000
500
0
18
16
14
12
10
8
6
4
2
0
R/ha
%
EASTERN FREE STATE
D
2002/2003
2003/2004
2004/2005
2005/2006
2006/2007
2007/2008
2008/2009
2009/2010
2010/2011
2011/2012
2012/2013
2013/2014
2014/2015
2015/2016
2016/2017
2017/2018
2018/2019
2019/2020
2020/2021
3 000
2 500
2 000
1 500
1 000
500
0
20
18
16
14
12
10
8
6
4
2
0
R/ha
%
MPUMALANGA