


 92 / 138

88
INPUT AND PRODUCTION OVERVIEW
Production costs
ACTUAL PRODUCTION COST
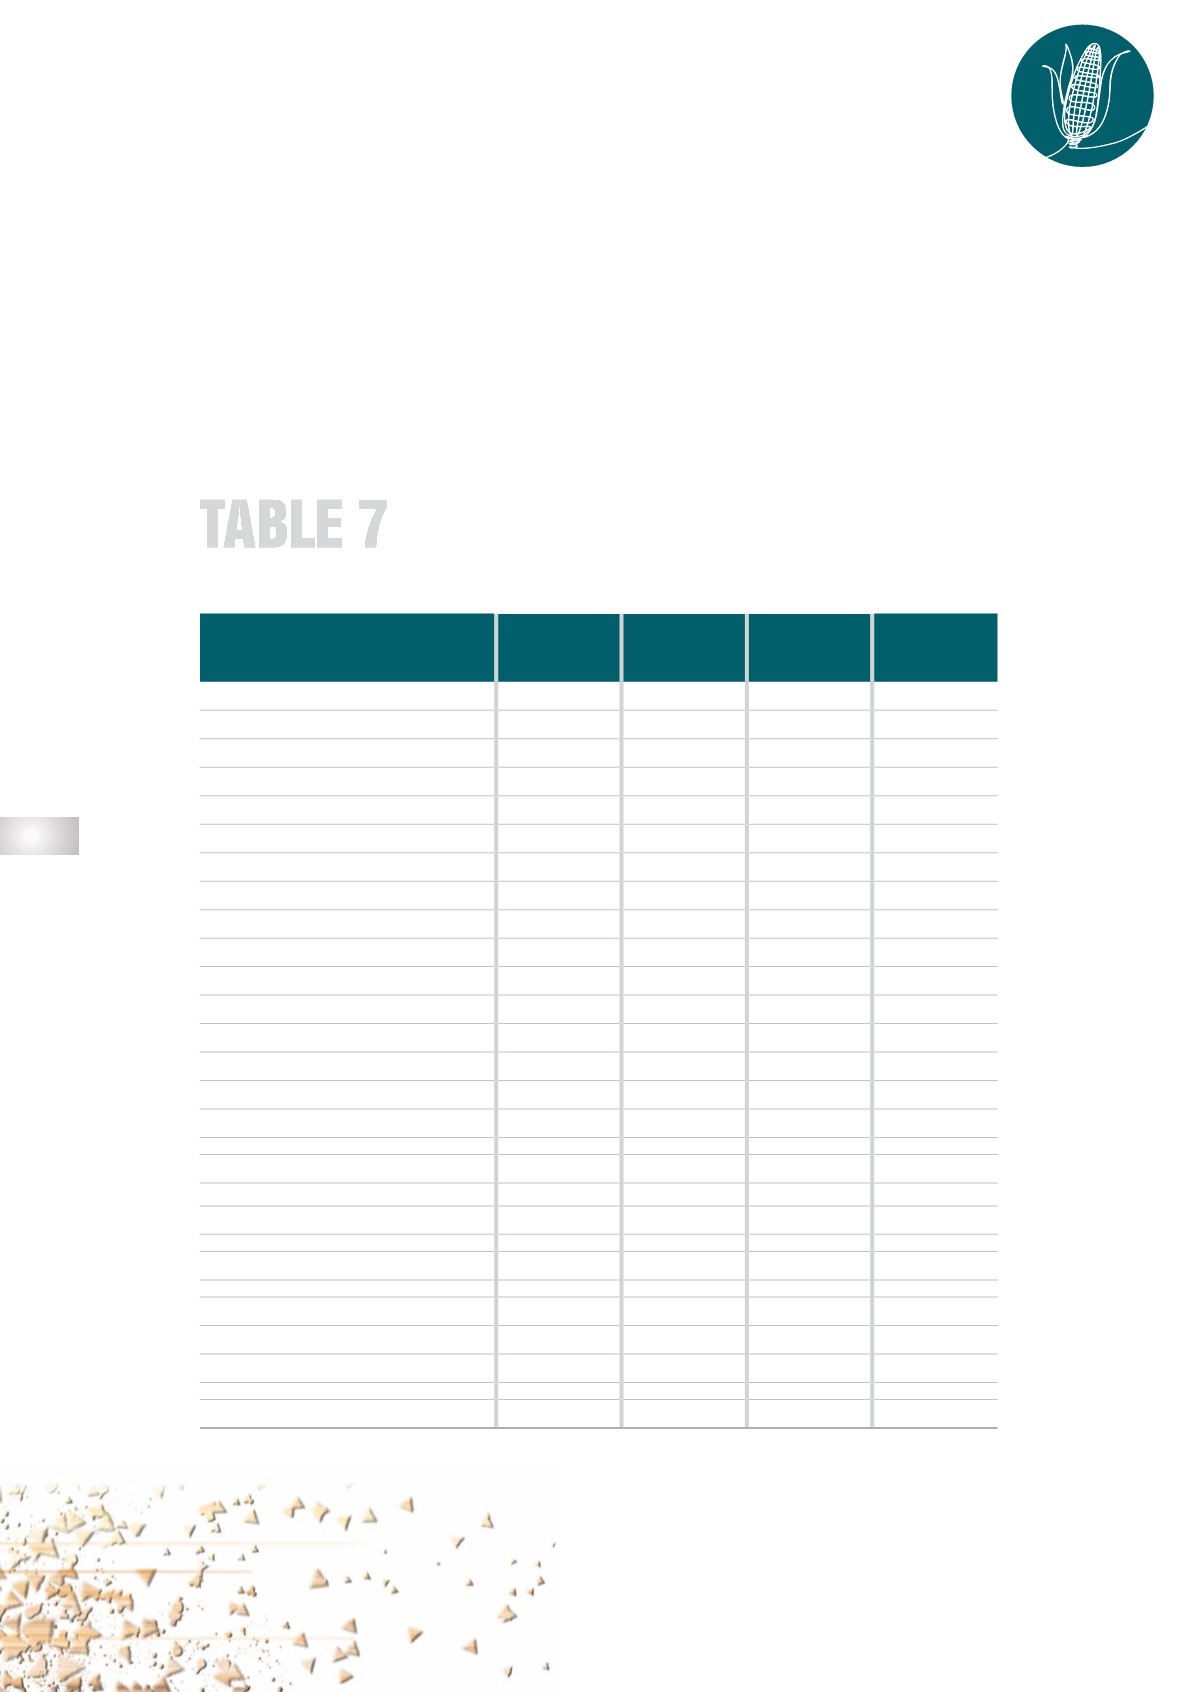
Grain SA collected/bought data and information during December 2021 and January 2022 to deter-
mine the actual income and production costs of the major maize production area for the 2020/2021
production season. Determining and gathering the historic actual income and production cost figures
are important to the industry as the figures identify the actual cost for various inputs and give an idea
of the profitability of a crop. Data was gathered from various associations and is kept up to date and
redistributed to various role-players in the maize industry.
The actual income and production cost analysis for dryland maize for the 2020/2021 production season
can be seen in
Table 7
. The table shows that variable input costs increase from the western parts to the
eastern parts of the country. Variable input cost in North West is calculated at R7 692/ton per hectare,
while it is around R15 481/ton in KwaZulu-Natal.
ACTUAL INCOME AND PRODUCTION COST FIGURES
FOR DRYLAND MAIZE (2020/2021 YEAR)
PRODUCTION COSTS
PER HECTARE
NORTH WEST
NORTH-WEST
FREE STATE
EASTERN
FREE STATE
KWAZULU-
NATAL
1. Variable costs
Seed
940,7
1 260,9
2 113,0
2 579,0
Fertiliser and lime
2 124,4
2 897,4
3 251,0
5 136,0
Weed and pest control
1 091,5
891,41
1 338,0
2 128,00
Fuel
664,8
1 086,5
1 073,0
1 025,0
Repairs and parts
663,7
759,7
1 912,0
1 297,0
Crop insurance
47,2
114,7
447,0
360,0
Casual labour
153,5
46,4
35,0
58,0
Permanent labour
363,4
442,7
1 254,0
1 080,0
Licence and insurance
0,0
86,1
0,0
318,0
Marketing cost
25,2
97,2
45,0
0,0
Drying and cleaning cost
0,0
30,2
274,0
0,0
Interest on production credit
536,7
636,5
984,5
1 080,1
Contract work
125,0
266,4
377,0
331,0
Other costs
956,6
507,5
1 007,0
89,0
Total variable costs
7 692,6
9 123,6
14 110,5
15 481,1
2. Capital costs
1 328,48
910,91
1 041,19
1 758,67
Total cost per hectare
9 021,07 10 034,49 15 151,64 17 239,75
Yield (t/ha)
5,5
5,81
5,80
9,40
Income
Producer price (R/ton)
2 343,36
2 751,88
3 161,00
2 901,00
Producer price (R/ha)
12 935,35 15 988,42 18 333,80 27 269,40
Profit/loss per ha
3 902,26
5 953,93
3 182,16 10 029,65