


 93 / 138

89
INPUT AND PRODUCTION OVERVIEW
ACTUAL INCOME AND PRODUCTION COST FIGURES FOR DRYLAND MAIZE
While
Table 7
(on page 88) depicts the actual production figures for the past year for the main different
production regions,
Graphs 12
to
15
(page 89 - 90) depict the long-term actual production costs,
yields and profit/loss situation of North West, the North-west Free State, the Eastern Free State and
KwaZulu-Natal seen since 2000/2001. This is just to illustrate the type of long-term information that is
gathered through this project.
From
Graphs 12
to
15
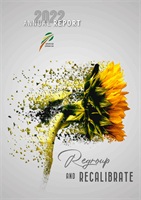
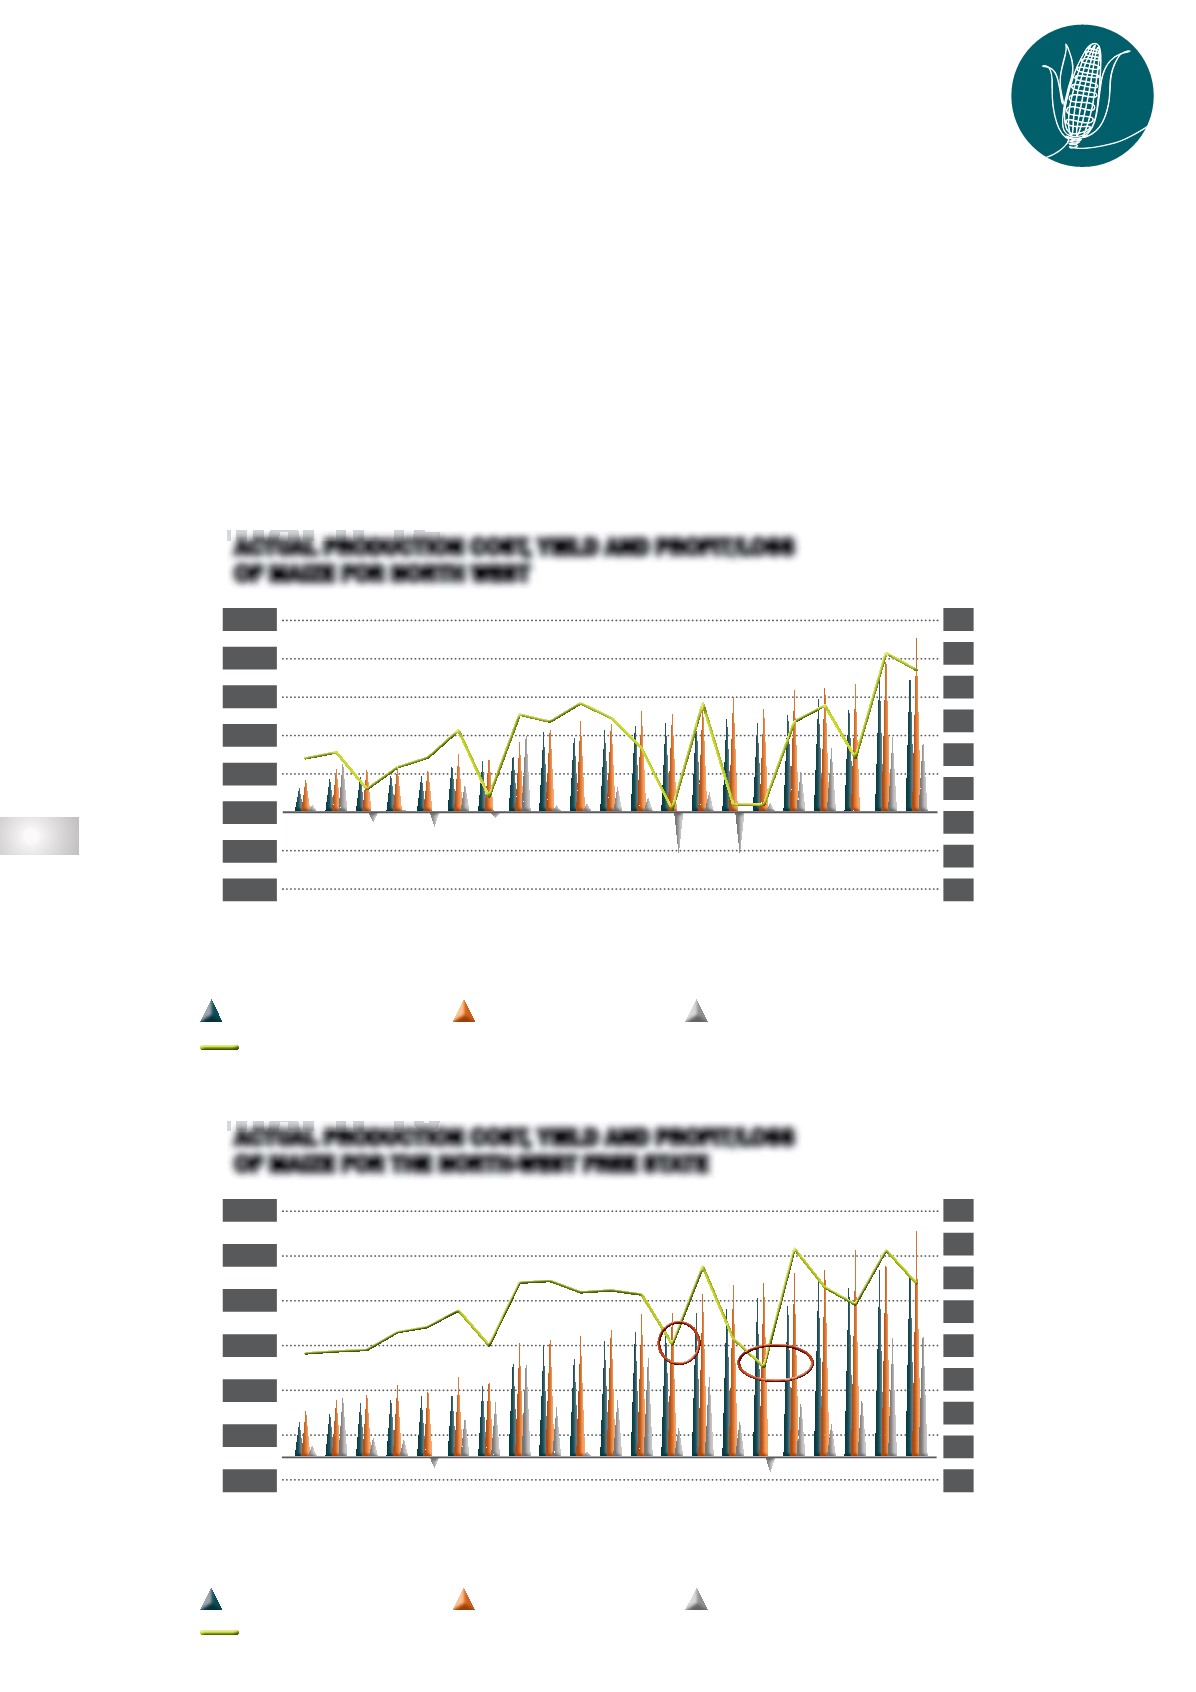
it is clear that production costs are constantly increasing over time. These
increases on a year-to-year basis are high and have a huge impact on producers, forcing them to
adapt and make adjustments to their current production systems in order to produce maize profit-
ably. The yield unpredictability can be seen in the long-term data presented and indicates the big
impact it has on profitability. The 2020/2021 season was generally a very good production year
and good yields were obtained. This brought some relief to producers’ financial situation, specifi-
cally in the western parts of the country.
GRAPH 12
ACTUAL PRODUCTION COST, YIELD AND PROFIT/LOSS
OF MAIZE FOR NORTH WEST
GRAPH 13
ACTUAL PRODUCTION COST, YIELD AND PROFIT/LOSS
OF MAIZE FOR THE NORTH-WEST FREE STATE
2000/2001
2001/2002
2002/2003
2003/2004
2004/2005
2005/2006
2006/2007
2007/2008
2008/2009
2009/2010
2010/2011
2011/2012
2012/2013
2013/2014
2014/2015
2015/2016
2016/2017
2017/2018
2018/2019
2019/2020
2020/2021
2000/2001
2001/2002
2002/2003
2003/2004
2004/2005
2005/2006
2006/2007
2007/2008
2008/2009
2009/2010
2010/2011
2011/2012
2012/2013
2013/2014
2014/2015
2015/2016
2016/2017
2017/2018
2018/2019
2019/2020
2020/2021
10 000
8 000
6 000
4 000
2 000
0
-2 000
-4 000
11 000
9 000
7 000
5 000
3 000
1 000
-1 000
7
6
5
4
3
2
1
0
-1
8
7
6
5
4
3
2
1
0
TOTAL VARIABLE COST
TOTAL VARIABLE COST
PROFIT/LOSS PER HA
PROFIT/LOSS PER HA
TOTAL COST PER HA
TOTAL COST PER HA
YIELD (T/HA)
YIELD (T/HA)
R/ha
R/ha
t/ha
t/ha
SOURCE: GRAIN SA
SOURCE: GRAIN SA