


 76 / 138

72
CANOLA
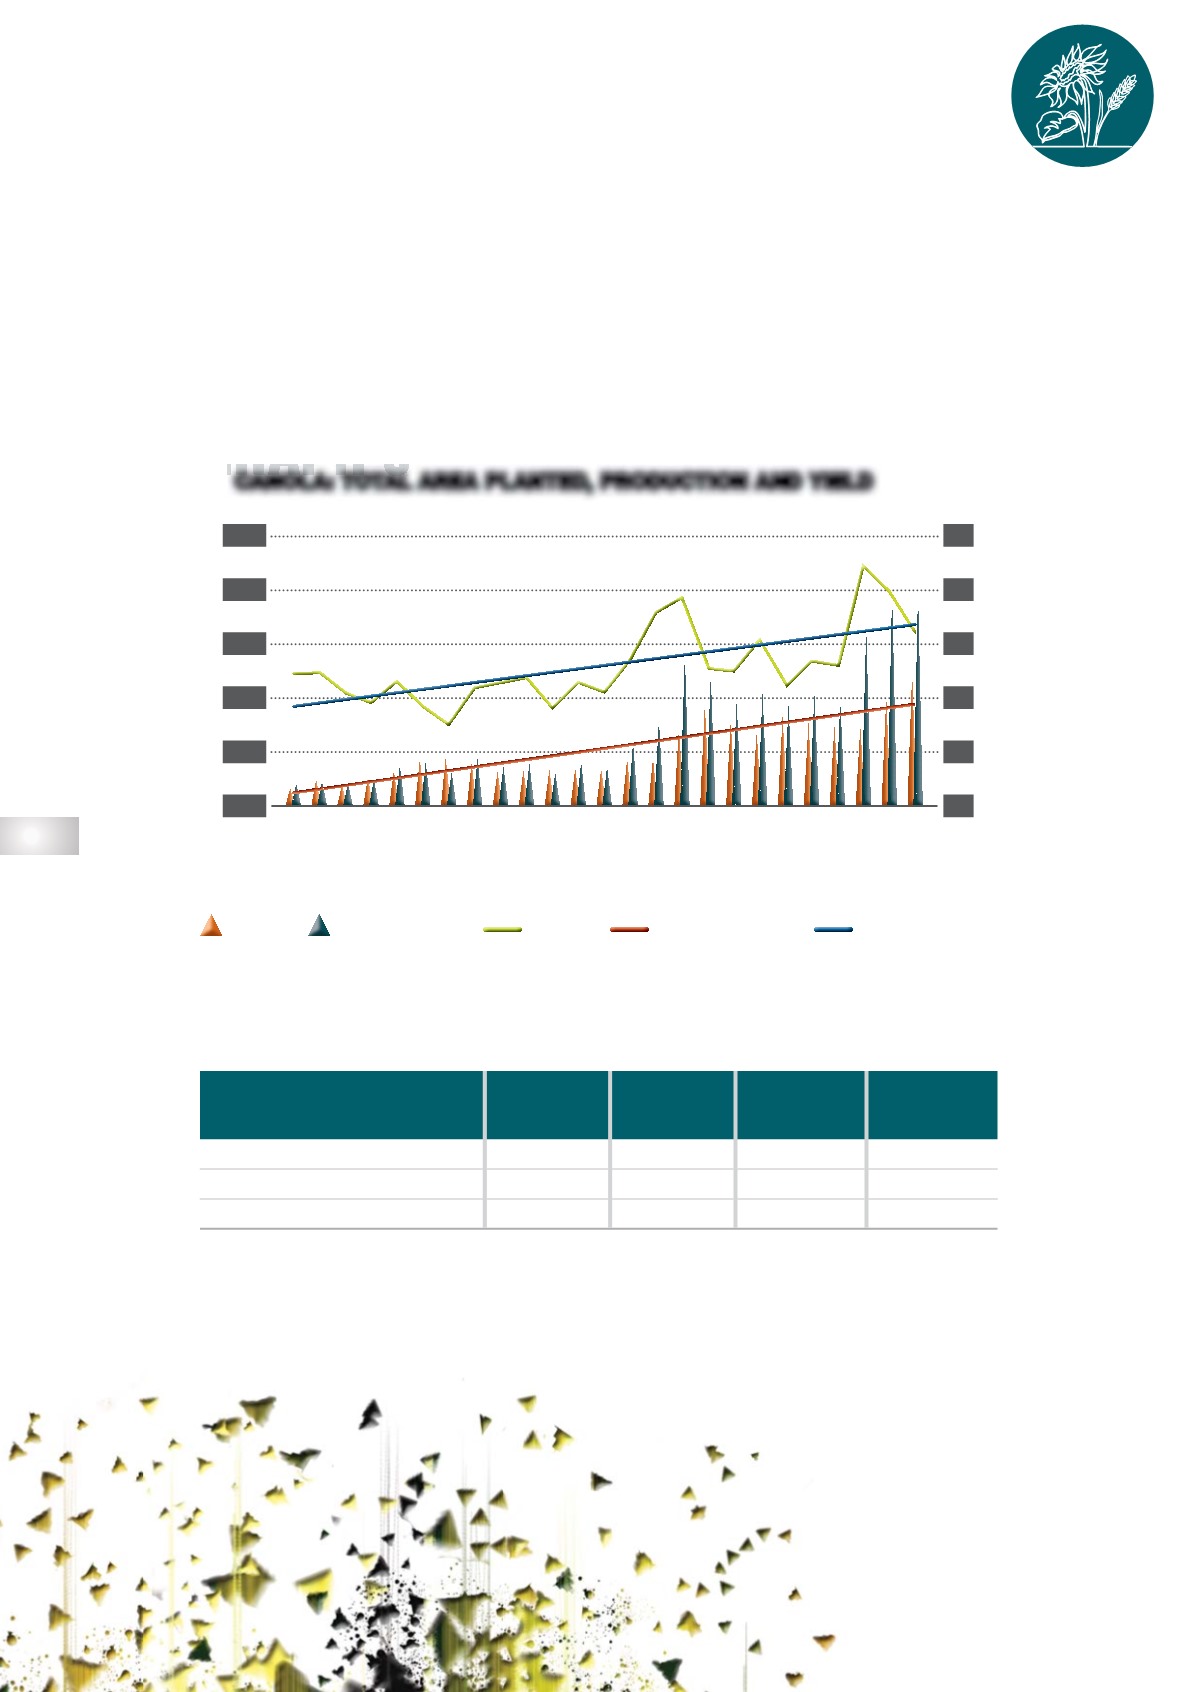
Graph 9
shows the area planted, production and average yield of canola from the 1998/1999
production season up to the 2022/2023 production season. The average yield for the 2021/2022
season was 1,98 t/ha, with a total production of 198 100 tons for the entire season. The average
yield per hectare declined somewhat from the average yield of 2,23 tons/ha in the previous pro-
duction season, as well as the 10-year average yield of 1,58 tons/ha. The CEC predicts a record
harvest for the 2022/2023 production season, with a planted area growing from 100 000 hectares
to 123 510 hectares. The 10-year average planted area is 76 700 hectares.
Table 9
contains the
production overview for canola in the 2021/2022 season.
GRAPH 9
CANOLA: TOTAL AREA PLANTED, PRODUCTION AND YIELD
TABLE 9
PRODUCTION OVERVIEW FOR CANOLA (2021/2022)
2020/2021 2021/2022
5-YEAR
AVERAGE
10-YEAR
AVERAGE
Total planted (hectares)
74 120
100 000
81 800
76 700
Total produced (tons)
165 200
198 100
131 500
120 000
Average yield (tons/ha)
2,23
1,98
1,60
1,58
1998/1999
1999/2000
2000/2001
2001/2002
2002/2003
2003/2004
2004/2005
2005/2006
2006/2007
2007/2008
2008/2009
2009/2010
2010/2011
2011/2012
2012/2013
2013/2014
2014/2015
2015/2016
2016/2017
2017/2018
2018/2019
2019/2020
2020/2021
2021/2022*
2022/2023*
250
200
150
100
50
0
2,5
2
1,5
1
0,5
0
PRODUCTION
AREA
YIELD
Thousand ha or ton
t/ha
LINEAR (YIELD)
LINEAR (AREA)
MARKET OVERVIEW FOR THE
2021/2022 PRODUCTION SEASON
*Preliminary