


 74 / 138

70
WHEAT
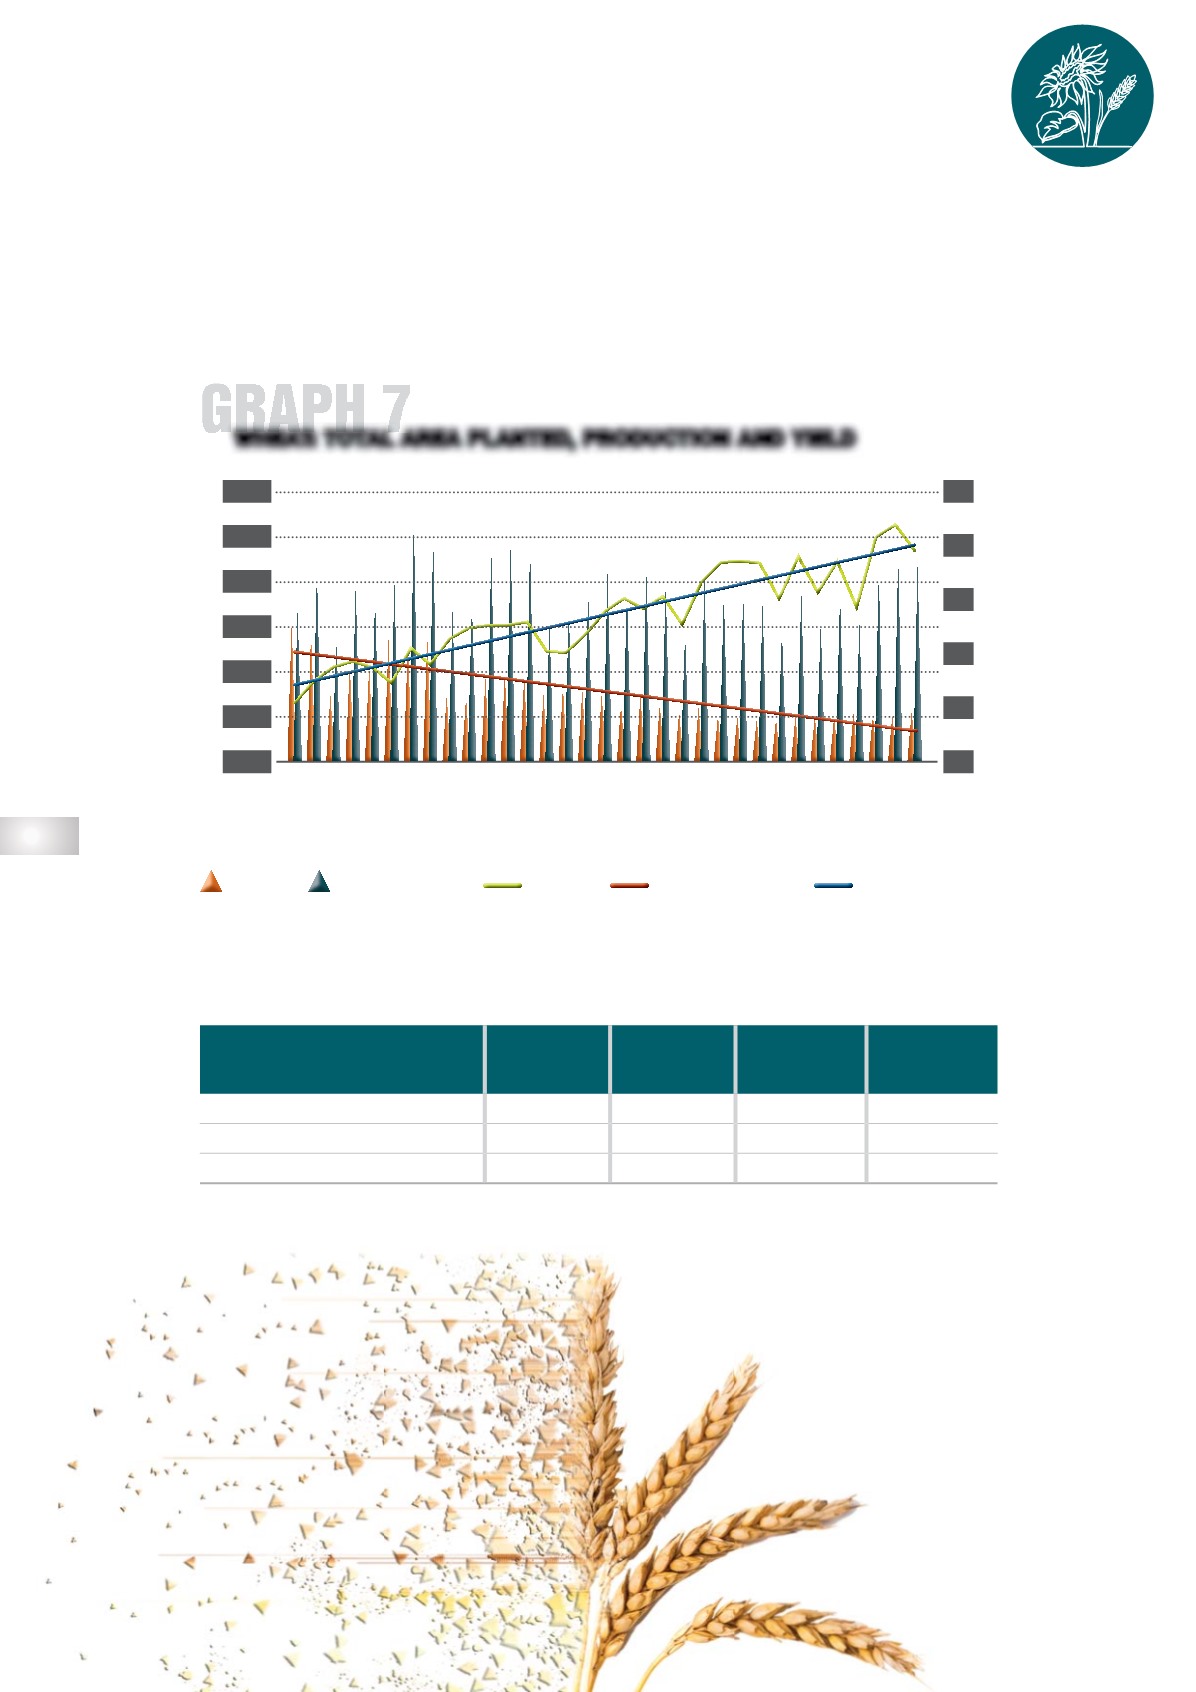
Graph 7
shows the area planted, production and the average yield of wheat in South Africa since
the 1990/1991 season. The total area of wheat planted during the 2021/2022 season amounted to
523 500 hectares. This showed an increase of 2,69% in the total area planted since the 2020/2021
production season. The total production for the current season was estimated at 2 285 000 tons,
with an average yield of 4,36 t/ha.
Table 7
contains the production overview for wheat in the
2021/2022 season.
WHEAT: TOTAL AREA PLANTED, PRODUCTION AND YIELD
TABLE 7
PRODUCTION OVERVIEW FOR WHEAT (2021/2022)
2020/2021 2021/2022
5-YEAR
AVERAGE
10-YEAR
AVERAGE
Total planted (hectares)
509 800
523 500
513 650
505 200
Total produced (tons)
2 109 100 2 285 000
1 866 420
1 818 900
Average yield (tons/ha)
4,14
4,36
3,64
3,60
1990/1991
1991/1992
1992/1993
1993/1994
1994/1995
1995/1996
1996/1997
1997/1998
1998/1999
1999/2000
2000/2001
2001/2002
2002/2003
2003/2004
2004/2005
2005/2006
2006/2007
2007/2008
2008/2009
2009/2010
2010/2011
2011/2012
2012/2013
2013/2014
2014/2015
2015/2016
2016/2017
2017/2018
2018/2019
2019/2020
2020/2021
2021/2022
2022/2023*
3 000
2 500
2 000
1 500
1 000
500
0
2,5
2
1,5
1
0,5
0
PRODUCTION
AREA
YIELD
Thousand ha or ton
t/ha
LINEAR (YIELD)
LINEAR (AREA)
MARKET OVERVIEW FOR THE
2021/2022 PRODUCTION SEASON