


 81 / 138

77
Because South Africa is a major importer of fertiliser, international availability and the price of fertiliser
have a direct impact on a producer’s bottom line. International fertiliser prices have hit record highs.
Some of the contributing factors for the dramatic increase in fertiliser prices are the Russian-Ukraine
war, which in effect had an impact on the availability of raw material, imposing of fertiliser bans,
closing of processing plants as well as drastic natural gas price increases.
Graph 4
(on page 78) shows the fertiliser price index compared to the maize price index since the
1985/1986 production season. At an estimated average producer price
[2]
of R3 667 per ton for the com-
ing production season (2022/2023), the gap between the maize price index and the fertiliser price index
continues to widen. This is no surprise given the sharp increase in fertiliser prices.
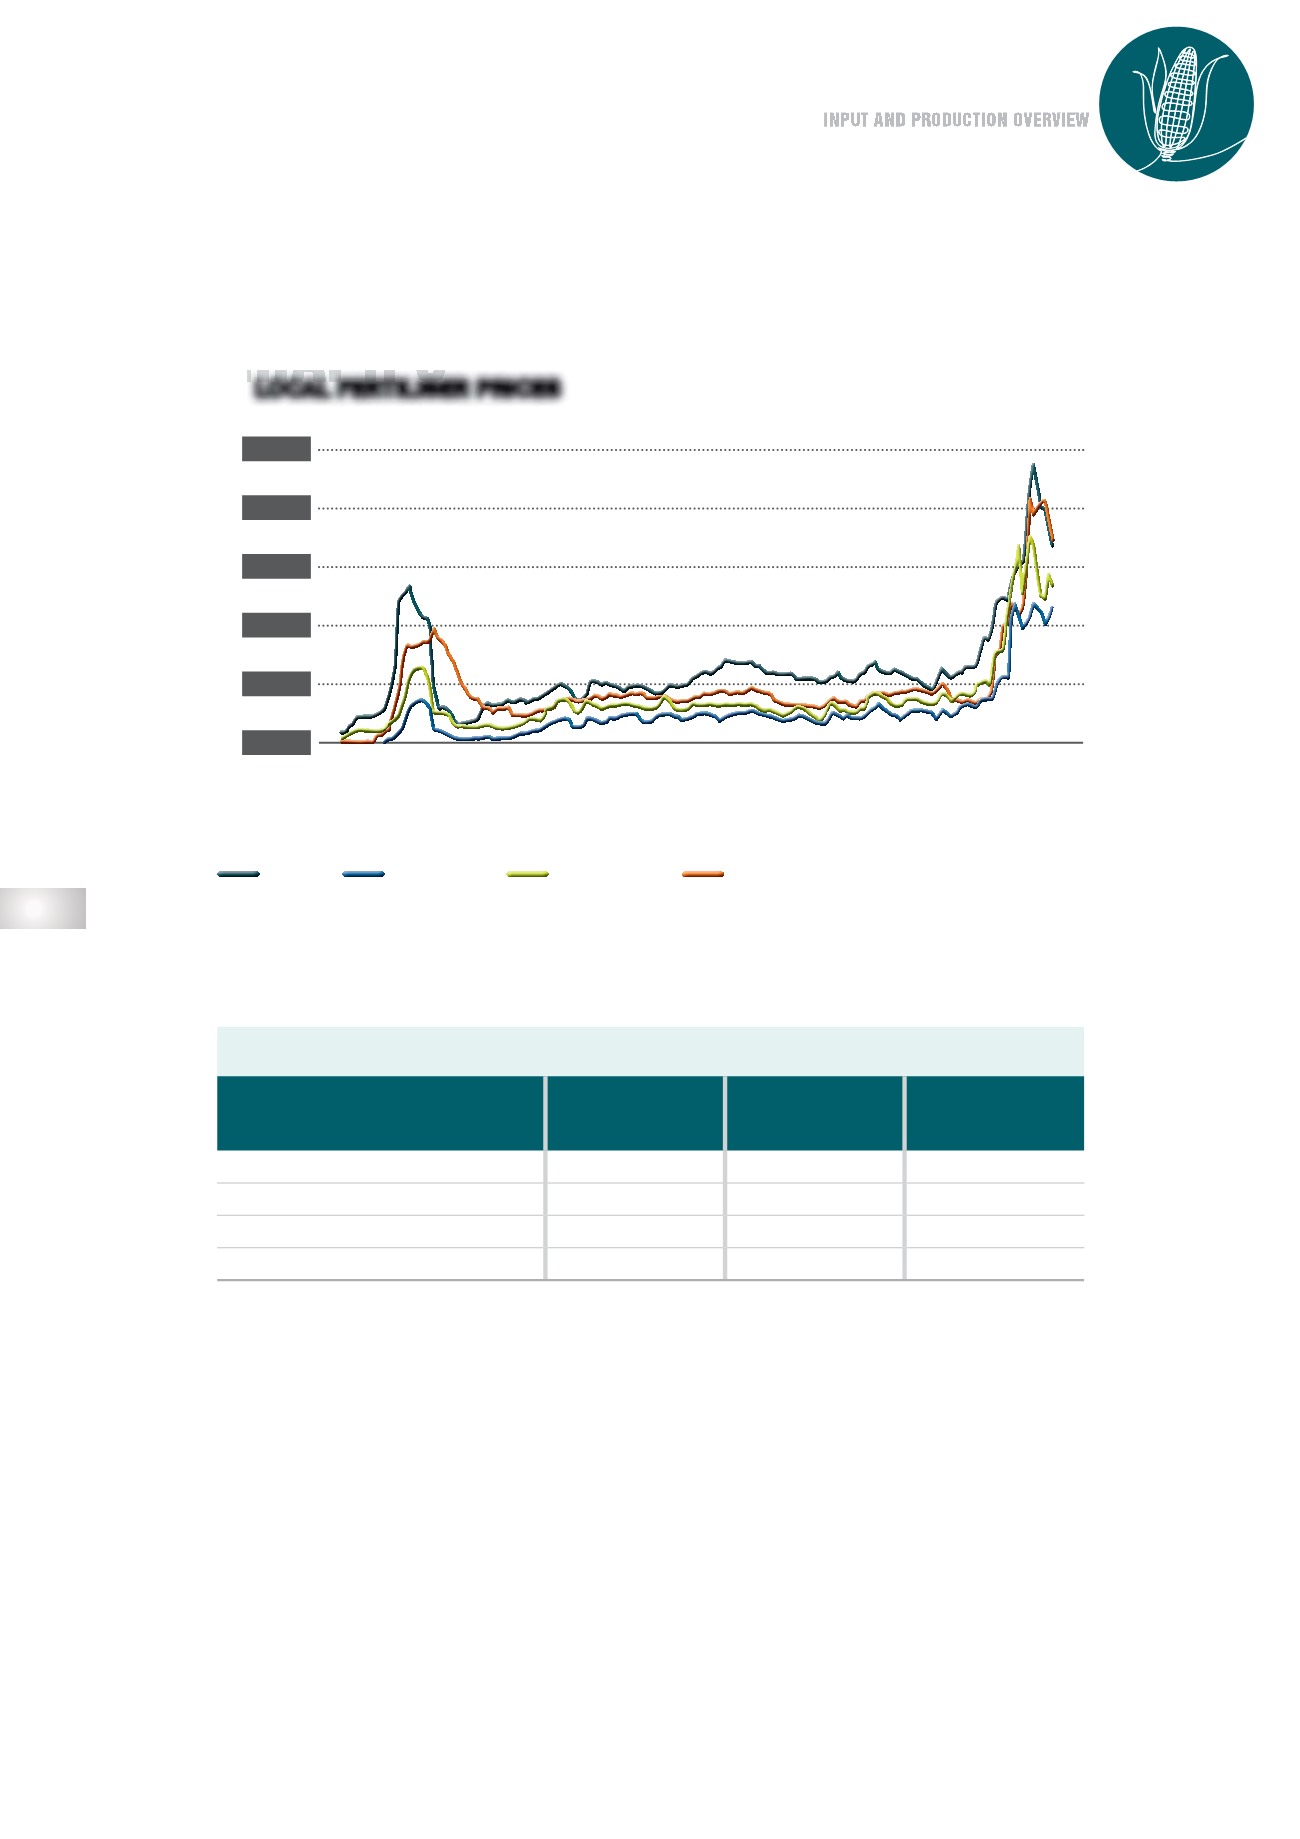
GRAPH 3
LOCAL FERTILISER PRICES
01/2007
01/2008
01/2009
01/2010
01/2011
01/2012
01/2013
01/2014
01/2015
01/2016
01/2017
01/2018
01/2019
01/2020
01/2021
01/2022
28 000
23 000
18 000
13 000
8 000
3 000
MAP
R/ton
LAN (28)
UREA (46)
POTASSIUM CHLORIDE (GRANULAR)
SOURCE: GRAIN SA
10/2022
TABLE 3
LOCA FERTILISER PRICES
Local fertiliser prices
FERTILISER
OCT 2021
R/TON
OCT 2022
R/TON
% CHANGE
LAN (28)
8 715
14 577
+67,3
Urea (46)
13 878
16 451
+18,5
MAP
15 286
19 812
+29,6
KCL
13 190
20 321
+54,1
[2]
Average producer price = Safex, July 2023 price, less (average differential cost + handling costs)